NZD/USD Price Analysis: Bulls assert dominance, closes its best week of 2024

Source Fxstreet
  • The daily chart reveals a strong bullish sentiment with indicators deep in positive territory.
  • Hourly indicators show a flattening buying traction but remain positive.
  • The pair closed its best week since November 2023.

In Friday's session, the NZD/USD rose to the 0.6137 level, demonstrating a strong bullish trend. After closing above its main Simple Moving Averages (SMAs) of 20,100 and 200 days, the pair secured its best week since late 2023.

On the daily chart, the Relative Strength Index (RSI) reveals a positive trend, moving from below 60 and nearing the 70 mark. This indicates that the NZD/USD pair is accumulating strength, demonstrating bullish pressure in the recent sessions. Concurrently, the Moving Average Convergence Divergence (MACD) prints green bars, showing steady buying traction.

NZD/USD daily chart

The hourly RSI readings exhibit a consistent positive trend over the recent hours, but was seen finishing at 57.17 but pointing downwards. The hourly MACD chart supports this view, with gradually diminishing green bars indicating a slowing positive momentum as investors take profits.

NZD/USD hourly chart
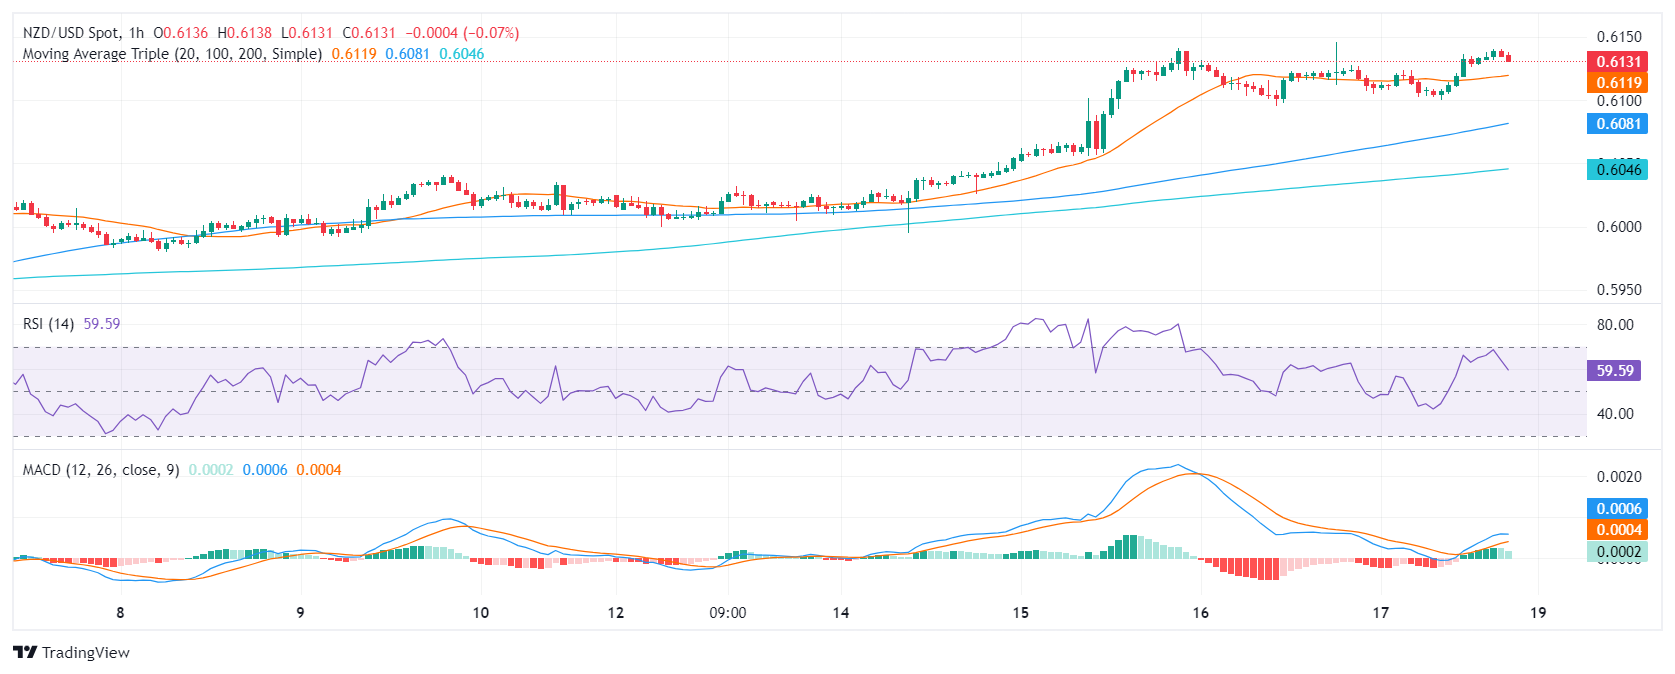
In conclusion, the NZD/USD is in a robust technical position, showing short and long-term bullish signals on the daily and short-term charts. Although the RSI shows that the pair is approaching overbought conditions and the  hourly indicators show dwindling positive momentum, the pair retains its position above vital SMAs. Traders shouldn’t take off the table further corrective movements as investors might continue taking profits.


NZD/USD

Overview
Today last price 0.6131
Today Daily Change 0.0010
Today Daily Change % 0.16
Today daily open 0.6121
 
Trends
Daily SMA20 0.5985
Daily SMA50 0.6008
Daily SMA100 0.6079
Daily SMA200 0.6039
 
Levels
Previous Daily High 0.6141
Previous Daily Low 0.6095
Previous Weekly High 0.6041
Previous Weekly Low 0.598
Previous Monthly High 0.6079
Previous Monthly Low 0.5851
Daily Fibonacci 38.2% 0.6113
Daily Fibonacci 61.8% 0.6123
Daily Pivot Point S1 0.6097
Daily Pivot Point S2 0.6073
Daily Pivot Point S3 0.6051
Daily Pivot Point R1 0.6143
Daily Pivot Point R2 0.6165
Daily Pivot Point R3 0.6189


Disclaimer: For information purposes only. Past performance is not indicative of future results.
placeholder
Why a Quiet 2025 Signals a Massive 2026 Crypto Bull Run: Bitwise CIO ExplainsBitwise's Matt Hougan Predicts a Crypto Boom in 2026 Amid Current Market Struggles
Author  Mitrade
Nov 13, Thu
Bitwise's Matt Hougan Predicts a Crypto Boom in 2026 Amid Current Market Struggles
placeholder
Bitcoin vs. Ethereum: Distinct Monetary UniversesBitcoin and Ethereum are diverging significantly in their monetary roles, according to a joint report from Glassnode and Keyrock.
Author  Mitrade
Yesterday 03: 01
Bitcoin and Ethereum are diverging significantly in their monetary roles, according to a joint report from Glassnode and Keyrock.
placeholder
Ethereum slides 5% as bears lean on $3,500 cap and put $3,150 support in focusEthereum (ETH) drops more than 5% after a failed push above $3,550, with price sliding to $3,153 and now holding below $3,350, the 100-hour SMA and a bearish trend line at $3,500; unless bulls reclaim the $3,350–$3,500 zone, the short-term bias stays bearish and a clean break under $3,150 could expose $3,050, $3,000 and even the $2,880–$2,850 support area.
Author  Mitrade
Yesterday 03: 41
Ethereum (ETH) drops more than 5% after a failed push above $3,550, with price sliding to $3,153 and now holding below $3,350, the 100-hour SMA and a bearish trend line at $3,500; unless bulls reclaim the $3,350–$3,500 zone, the short-term bias stays bearish and a clean break under $3,150 could expose $3,050, $3,000 and even the $2,880–$2,850 support area.
placeholder
Gold Posts Biggest Weekly Gain in a Month as US Data Delays Fuel UncertaintyGold climbed higher on Friday, marking its strongest weekly performance in a month, as traders weighed the impact of a data backlog following the end of the US government's extended shutdown. Silver also moved upward.
Author  Mitrade
Yesterday 05: 48
Gold climbed higher on Friday, marking its strongest weekly performance in a month, as traders weighed the impact of a data backlog following the end of the US government's extended shutdown. Silver also moved upward.
placeholder
Top 3 Price Prediction: Bitcoin, Ethereum, Ripple – BTC, ETH, and XRP flash deeper downside risks as market selloff intensifiesBitcoin (BTC), Ethereum (ETH) and Ripple (XRP) trade in red on Friday after correcting more than 5%, 10% and 2%, respectively, so far this week.
Author  FXStreet
Yesterday 08: 32
Bitcoin (BTC), Ethereum (ETH) and Ripple (XRP) trade in red on Friday after correcting more than 5%, 10% and 2%, respectively, so far this week.
Related Instrument
goTop
quote