


Vertiv Holdings Co Stock (VRT) Moved Up by 13.60% on Oct 28: What Signal Does It Send?
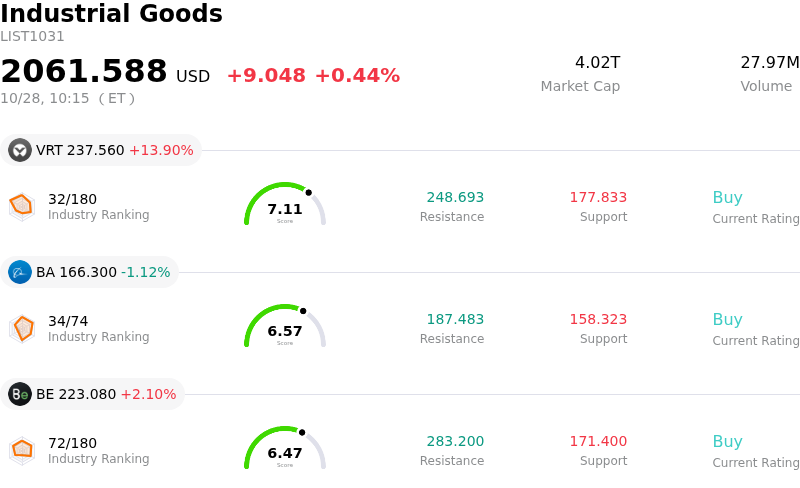
Vertiv Holdings Co (VRT) moved up by 13.60%. The Industrial Goods sector is up by 0.44%. The company outperformed the industry. Top 3 stocks by turnover in the sector: Vertiv Holdings Co (VRT) up 13.90%; Boeing Co (BA) down 1.10%; Bloom Energy Corp (BE) up 2.10%.
What is driving Vertiv Holdings Co (VRT)’s stock price up today?
Vertiv Holdings experienced strong upward momentum following the release of its third-quarter financial results, which significantly surpassed Wall Street estimates across top and bottom lines. Net sales recorded substantial year-over-year growth, driven by broad-based geographic demand and robust organic expansion. Adjusted earnings per share delivered a noticeable outperformance compared to consensus expectations, fueled by disciplined cost execution, favorable pricing, and strong operational leverage.
The core catalyst behind investor enthusiasm was an explosive acceleration in order intake. Organic orders more than doubled year-over-year during the quarter, signaling that hyperscale data center operators and enterprise customers are accelerating capital investments in critical artificial intelligence infrastructure. Vertiv's power management and thermal management solutions remain central to high-density compute deployments. Furthermore, adjusted operating margins expanded meaningfully, demonstrating the company's ability to efficiently convert higher order volume into expanding profitability.
Adding to market confidence, management raised its full-year net sales and adjusted earnings guidance. The upward revision reflects sustained demand visibility and ongoing capacity expansions designed to meet accelerating infrastructure needs. Recent strategic initiatives, including acquisitions aimed at expanding global fluid management services and partnerships supporting pre-engineered AI deployments, further reinforced Vertiv's competitive moat within the data center supply ecosystem.
Technical Analysis of Vertiv Holdings Co (VRT)
Technically, Vertiv Holdings Co (VRT) shows a MACD (12,26,9) value of 1.923, indicating a neutral signal. The RSI at 54.550 suggests neutral condition and the Williams %R at 19.331 suggests overbought condition. Please monitor closely.
Media Coverage of Vertiv Holdings Co (VRT)
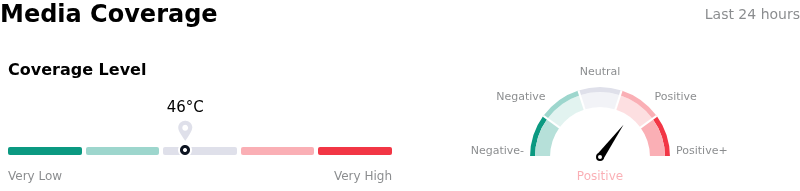
In terms of media coverage, Vertiv Holdings Co (VRT) shows a coverage score of 46, indicating a moderate level of media attention. The overall market sentiment index is currently in bullish zone.
Fundamental Analysis of Vertiv Holdings Co (VRT)
Vertiv Holdings Co (VRT) is in the Industrial Goods industry. Its latest annual revenue is $10.23B, ranking 17 in the industry. The net profit is $1.33B, ranking 13 in the industry. Company Profile
Over the past month, multiple analysts have rated the company as Buy, with an average price target of $322.66, a high of $400.00, and a low of $188.00.
More details about Vertiv Holdings Co (VRT)
Company Specific Risks:
- Hyperscaler CapEx Sustainability: Market anxiety surrounding the massive debt burdens acquired by technology hyperscalers to finance AI data center buildouts introduces revenue vulnerability for Vertiv's core power and liquid cooling equipment if customer capital expenditures moderate.
- Analyst Downgrades and Valuation Sensitivity: Recent price target cuts by institutional analysts at Mizuho and RBC, combined with downgrades to Hold by Wall Street Zen, reflect concerns that Vertiv's elevated valuation premium leaves minimal margin for error.
- Free Cash Flow Margin Compression: Vertiv's Q3 2026 financial report disclosed a year-over-year contraction in free cash flow margin to 15.1% (down from 17.3% in Q3 2025), driven by elevated capital outlays and inventory investments needed to support rapid manufacturing expansion.
- Equity Dilution and Insider Stock Liquidation: The Form 8-K filing on October 28, 2026, detailed an increase in total common shares outstanding to 385.03 million, coinciding with recent SEC filings indicating substantial insider stock sales by company directors.
Recommended Articles


