

Brent's $115 front month sits $4.6 above January — the $14 spread to WTI is the supply-risk premium


coverImg
Source: DepositPhotos

Three numbers explain Brent this morning. December Brent trades at $115.29. January Brent trades at $110.71. And December Brent costs $14.2 more than December WTI, against a normal $3-5 gap. The first two numbers are a roll; the third is the supply-risk premium, and it has not gone away.
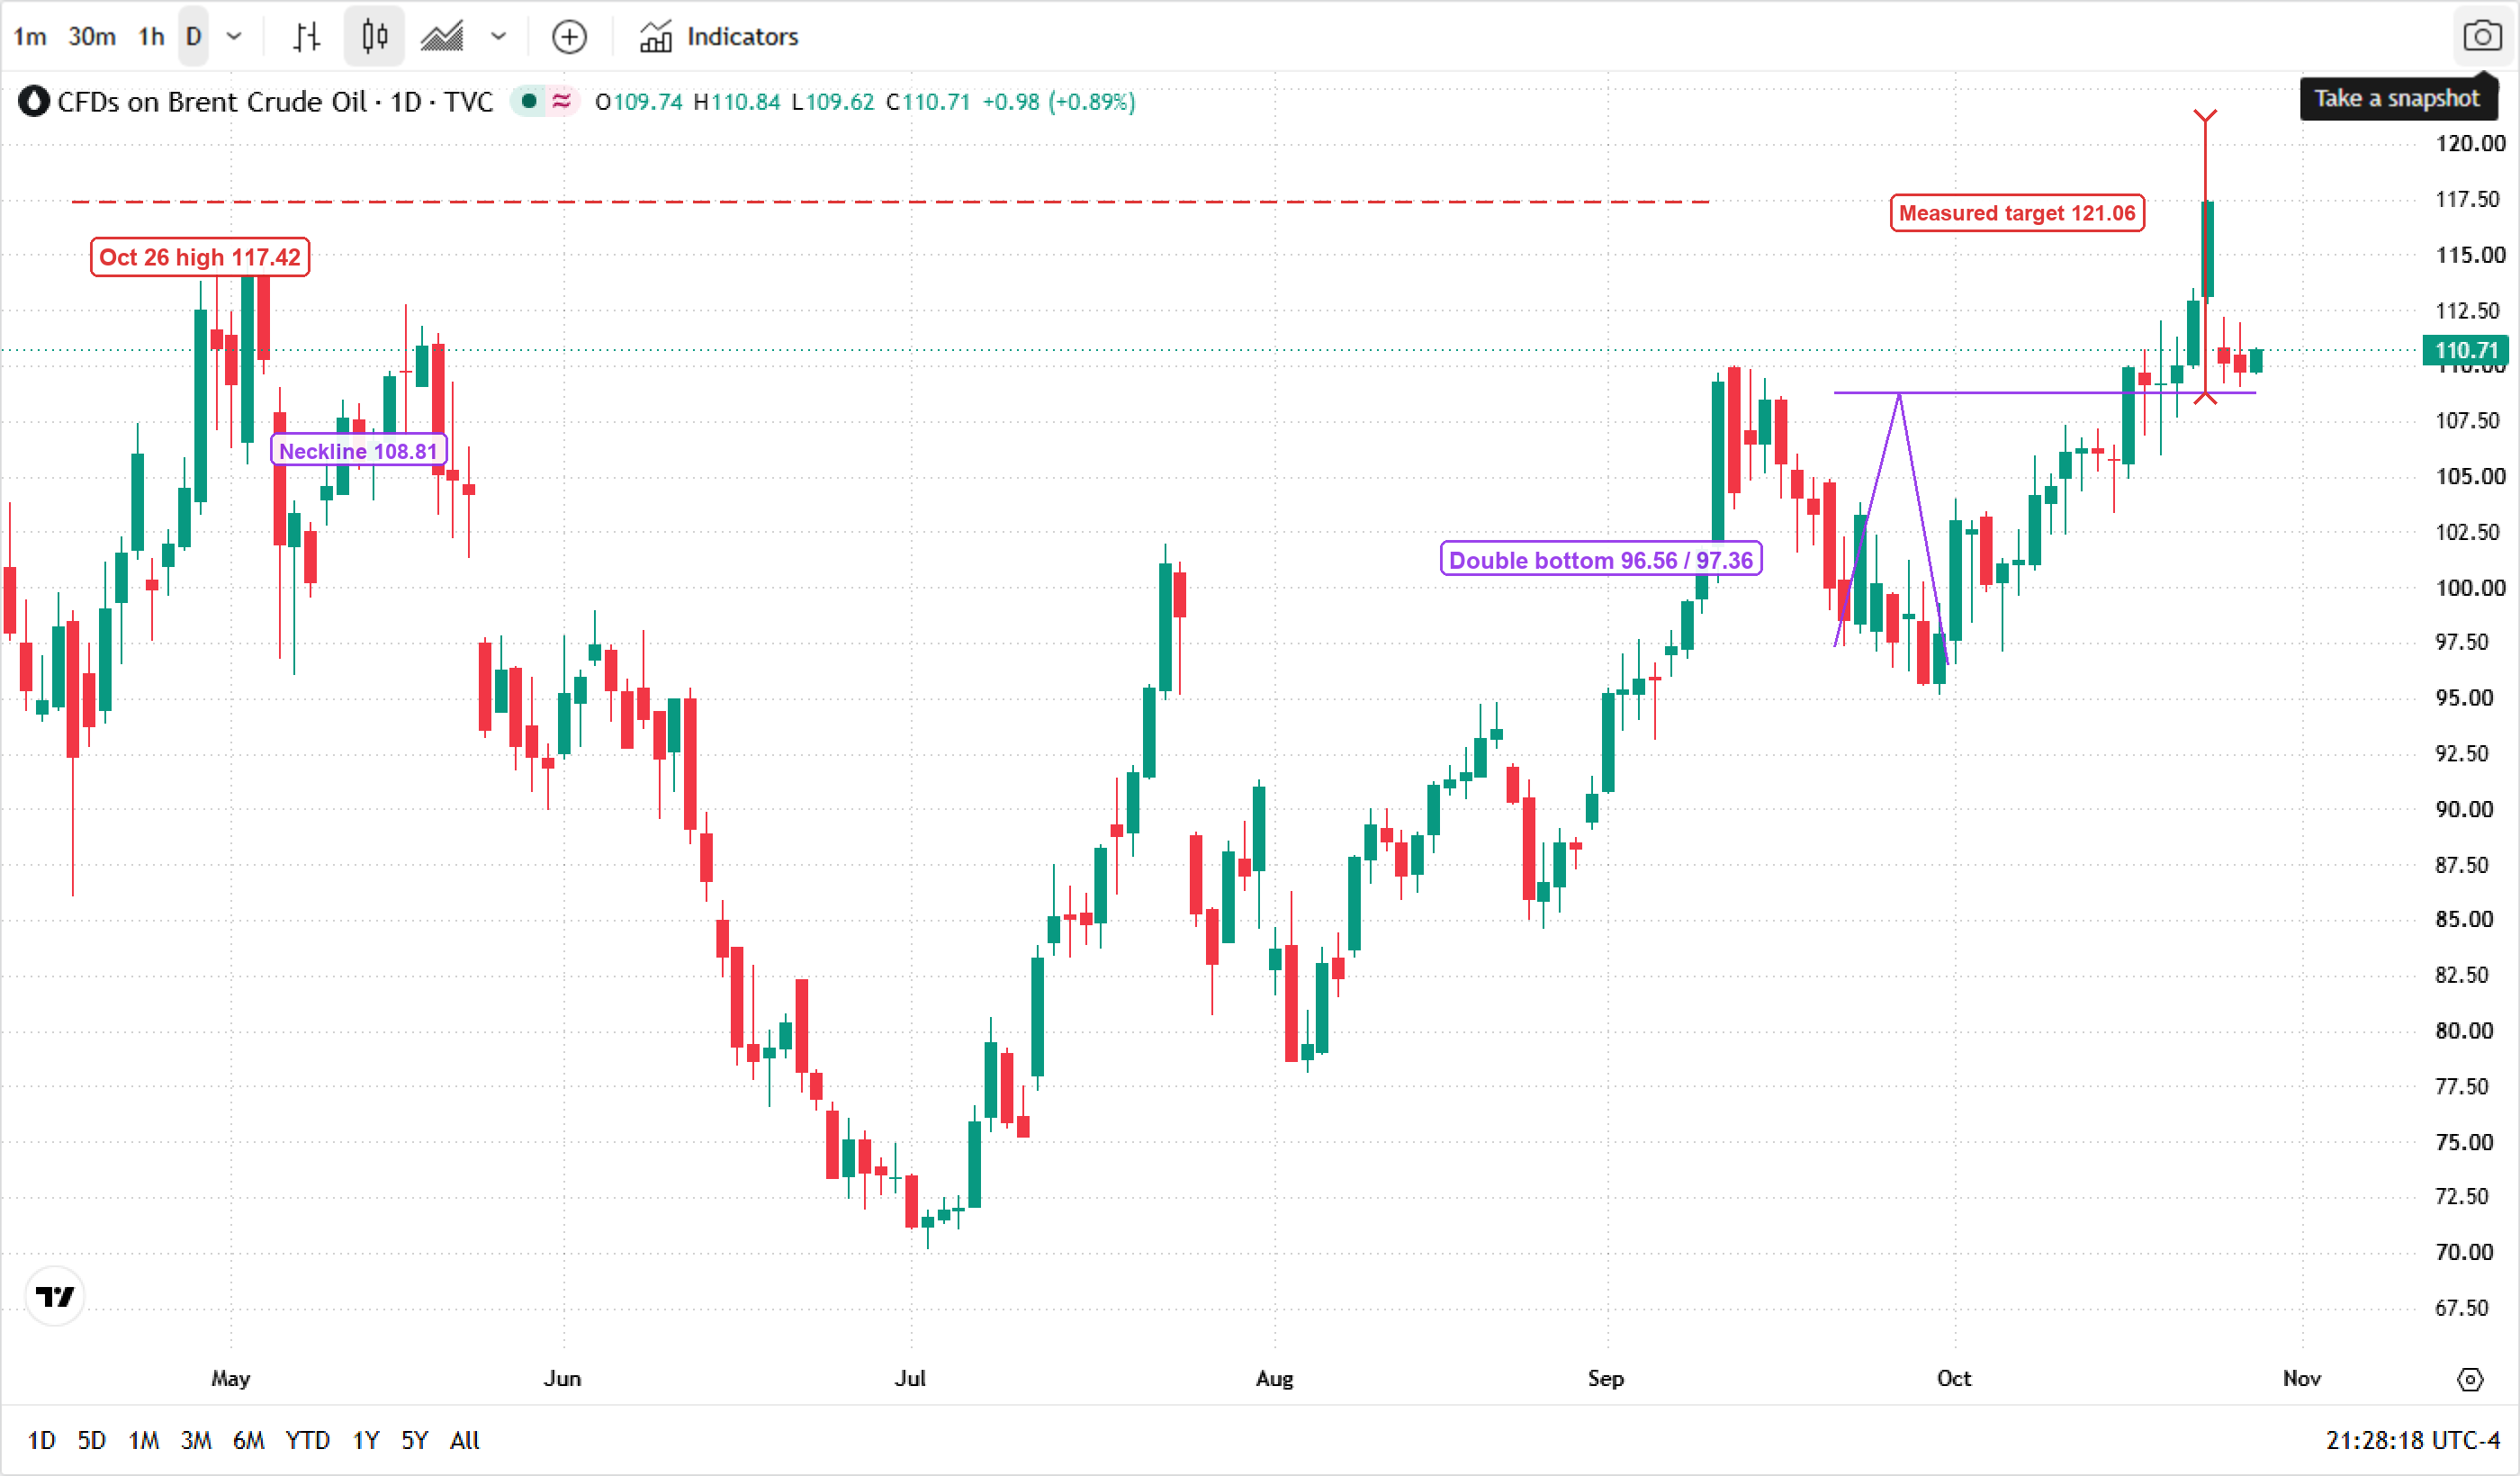
Brent crude daily chart on October 28, 2026, with the January contract at $110.71, the double-bottom neckline at $108.81 and a measured target of $121.06 * Chart source: TradingView (TVC:UKOIL, daily, New York time)

The $14 gap is the premium

Start with the spread, because it is the cleanest read. Brent and WTI are both light sweet crude, but Brent prices waterborne barrels that must transit the Strait of Hormuz; WTI prices barrels sitting in Oklahoma. When the market prices a supply disruption, the premium shows up in Brent first.

At $14.2, the December Brent-WTI spread is roughly three times its normal $3-5 range. Even the January spread — $110.71 minus $99.07 — is $11.6. That is not a rounding error. It is the market saying that the risk is physical, and that it is concentrated in the front of the curve.

$14.2 today, $11.6 in January

The decay from $14.2 to $11.6 matters. If the premium were a permanent re-rating of waterborne crude, the spread would be flat across months. Instead it slopes downward, which means traders expect the risk to fade with time — but not disappear. UBS still sees Brent around $110 at year-end, roughly where the January contract is now.

$4.6 versus $2.0: the curve says the risk is in the water

The second comparison is inside Brent itself. December Brent is $4.58 above January Brent. For WTI, the same December-January gap is only $1.99.

That difference — $4.58 versus $1.99 — is the term-structure version of the same story. Backwardation of this size means buyers of prompt cargoes are paying up, while buyers of later cargoes are not. The physical tightness is in the water, not in the ground.

The talks knocked the back, not the front

On October 26, senior officials from Saudi Arabia, Turkey and Pakistan met Iranian leaders in Tehran and agreed to continue talks on regional security. December Brent settled at $113.88 on October 27, down 1.67%, and WTI at $99.90, down 1.83% — a headline-driven dip, not a structural break.

Today both contracts are higher again. December Brent is up about 1.2%, WTI about 1.2%. The January contract is up 0.89%.

The roll will cut the headline by $4.6 on October 30

Here is the part that is easy to misread. The December Brent contract expires on October 30. After that, the continuous Brent series rolls to January, and the headline price will drop by roughly $4.6 overnight — without a single barrel moving, and without any diplomatic progress.

If you see "Brent falls $4.6" on October 31, that is the roll, not the risk premium. The spread to WTI is the number to watch, because it is roll-adjusted.

The counter-evidence: 28 attacks in October. The strongest argument against the "premium is fading" view is physical, not verbal. Shipping disruptions near the Strait of Hormuz reached 28 incidents in October, the highest since 2017, according to reports compiled this week. A fire at Saudi Arabia's Ras Tanura refinery, the country's largest, has also kept supply concerns alive.

Diplomacy can lower the expected premium. It cannot reopen a refinery or clear a shipping lane. That is why the front month keeps holding above $110 even as the headlines turn constructive.

Three triggers, and the 108.81 line

The chart adds one more layer. January Brent completed a double bottom at $96.56 (October 1) and $97.36 (September 22), broke the $108.81 neckline, and reached $117.42 on October 26 before pulling back. The measured target is $121.06. At $110.71, the January contract is 1.7% above the neckline — a retest, not a breakdown.

TriggerDirectionWhat it targets
January holds above $108.81Base case$117.42 retest, then $121.06 measured target
January closes below $108.81Risk case$100.00, then the $96.56 double-bottom low
December-January spread widens above $5Physical tightness persistsFront-month premium stays; Brent-WTI holds above $12
December-January spread compresses below $3De-escalation gets pricedBrent-WTI slides toward $8; $108.81 becomes the line to defend

The bear case is simple and should not be dismissed: if the talks produce a credible de-escalation, the $14.2 Brent-WTI spread can compress toward $5. That is roughly $9 of downside on Brent without any change in global demand. The bull case is equally simple: 28 attacks in a month and a fire at Saudi Arabia's largest refinery are not de-escalation.

What the curve says today is that neither side has won. The front month is still paid up; the back of the curve is already discounting peace. That is a market pricing a probability, not a conclusion.

Read more

  • US Dollar Index Price Forecast: DXY could target 104.00 as bulls await FOMC Minutes
  • Gold Price Forecast: XAU/USD regains ground below $3,700, outlook remains fragile
  • Australian Dollar falls below 0.6700 as Unemployment Rate jumps to the highest level in five years
  • Note: If you want to share the article 《Brent's $115 front month sits $4.6 above January — the $14 spread to WTI is the supply-risk premium》, make sure you retain the original link. For more information, please visit Insights or browse www.mitrade.com.

    * The content presented above, whether from a third party or not, is considered as general advice only.  This article should not be construed as containing investment advice, investment recommendations, an offer of or solicitation for any transactions in financial instruments.

    goTop
    quote
    Related Articles
    placeholder
    Weekly Report: Gold's $4,000 reclaim and Brent's $100 break were right calls — the silver call was wrongLast week this report said gold's $4,000 reclaim was not the trend and that Brent's supply premium was over. Gold fell 4.7% to $3,884.69 and Brent fell 2.52% to $95.84, so both were right. The call that missed was silver: we read a gold-silver ratio of 78.7 as silver being cheap, and the ratio instead broke above 80 to 81.1 as silver fell 5.35%. This report grades the three calls, explains the miss, and sets this week's scorecard around 3,852 gold, 93.73 Brent and 6.00 copper.
    Author  Irene Q.
    Nov 16, Mon
    Last week this report said gold's $4,000 reclaim was not the trend and that Brent's supply premium was over. Gold fell 4.7% to $3,884.69 and Brent fell 2.52% to $95.84, so both were right. The call that missed was silver: we read a gold-silver ratio of 78.7 as silver being cheap, and the ratio instead broke above 80 to 81.1 as silver fell 5.35%. This report grades the three calls, explains the miss, and sets this week's scorecard around 3,852 gold, 93.73 Brent and 6.00 copper.
    placeholder
    Brent rose 3.3% and US crude stocks built 4.66 million barrels in the same weekBrent January settled at 95.82, up 3.3%, and WTI at 88.74, up 2.55%, after the US signalled it would not pursue a deal with Iran and attacks on Gulf shipping continued. In the same week, EIA data showed US crude inventories rising 4.657 million barrels against expectations of a 1.1 million draw, with gasoline up another 1.799 million. OPEC output also rebounded 1.96 million barrels a day to 27.16 million in October, led by Saudi Arabia at 10.56 million. This piece separates the geopolitical premium from the physical balance and lays out where each side of the trade is anchored.
    Author  Irene Q.
    Nov 13, Fri
    Brent January settled at 95.82, up 3.3%, and WTI at 88.74, up 2.55%, after the US signalled it would not pursue a deal with Iran and attacks on Gulf shipping continued. In the same week, EIA data showed US crude inventories rising 4.657 million barrels against expectations of a 1.1 million draw, with gasoline up another 1.799 million. OPEC output also rebounded 1.96 million barrels a day to 27.16 million in October, led by Saudi Arabia at 10.56 million. This piece separates the geopolitical premium from the physical balance and lays out where each side of the trade is anchored.
    placeholder
    US President Donald Trump says military action against Iran doesn't seem to be necessaryUS President Donald Trump said that further strikes on Iran wouldn’t be necessary, but the US remains “locked and loaded,” Bloomberg reported on Monday. Trump added that there is "positive momentum" towards an end to the Iran war.
    Author  FXStreet
    Nov 10, Tue
    US President Donald Trump said that further strikes on Iran wouldn’t be necessary, but the US remains “locked and loaded,” Bloomberg reported on Monday. Trump added that there is "positive momentum" towards an end to the Iran war.
    placeholder
    Weekly Report: Gold up 4.5%, Brent down 16.4% — three commodity regimes just resetGold rose 4.51% to $4,074.90 while Brent fell 16.42% to $98.32 in the same five sessions — two inflation hedges, opposite answers. Around them, the gold-silver ratio sits at 78.7 and copper fell 3.72%. Three regime signals, two of them close to flipping, define what commodity traders must re-price before Tuesday's CPI.
    Author  Irene Q.
    Nov 09, Mon
    Gold rose 4.51% to $4,074.90 while Brent fell 16.42% to $98.32 in the same five sessions — two inflation hedges, opposite answers. Around them, the gold-silver ratio sits at 78.7 and copper fell 3.72%. Three regime signals, two of them close to flipping, define what commodity traders must re-price before Tuesday's CPI.
    placeholder
    WTI struggles below $87.50 as Democrats seek end to Iran war after midterm sweepWest Texas Intermediate (WTI) – the benchmark US Crude Oil price – remains depressed for the second straight day on Thursday, trading just below mid-$87.00s during the Asian session and close to a near one-month low touched the previous day.
    Author  FXStreet
    Nov 05, Thu
    West Texas Intermediate (WTI) – the benchmark US Crude Oil price – remains depressed for the second straight day on Thursday, trading just below mid-$87.00s during the Asian session and close to a near one-month low touched the previous day.
    Live Quotes
    Name / SymbolChart% Change / Price
    UKOIL
    UKOIL
    0.00%0.00
    USOIL
    USOIL
    0.00%0.00

    Oil Related Articles

    • Best Oil Trading Platforms in 2026: A Complete Guide for Retail Traders
    • Should I Invest in Oil Right Now? The 2026 Oil Price Forecast
    • Crude Oil Trading: How To Invest In WTI/Brent Oil?
    • WTI Moves Upward Near $75.50 on Dovish Fed Outlook, Maersk, CMA CGM Return to Red Sea

    Click to view more