


NVIDIA Corp Stock (NVDA) Moved Down by 3.95% on Oct 22: What Signal Does It Send?
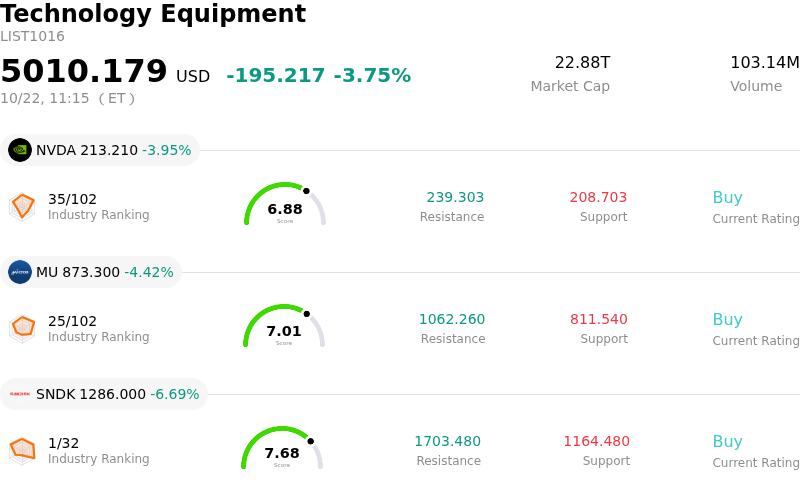
NVIDIA Corp (NVDA) moved down by 3.95%. The Technology Equipment sector is down by 3.75%. The company underperformed the industry. Top 3 stocks by turnover in the sector: NVIDIA Corp (NVDA) down 3.95%; Micron Technology Inc (MU) down 4.42%; SanDisk Corporation (SNDK) down 6.65%.
What is driving NVIDIA Corp (NVDA)’s stock price down today?
The downward pressure on Nvidia shares is primarily driven by a broader risk-off sentiment sweeping across the technology and semiconductor sectors. A surge in global energy prices driven by escalating geopolitical tensions in the Middle East has reignited macroeconomic concerns regarding sticky inflation and elevated interest rates. Higher rate expectations traditionally compress valuation multiples for high-growth technology equities, prompting investors to pare back exposure to high-beta mega-cap leaders.
Sector-specific developments further exacerbated the pullback. Although artificial intelligence infrastructure demand remains structurally robust, recent earnings and forward guidance across the broader semiconductor supply chain failed to surpass exceptionally high market expectations. As a result, market participants are demonstrating increased sensitivity toward elevated valuations and questioning the timeline for monetizing massive AI capital expenditures. While Nvidia continues to demonstrate technology leadership and report solid operational momentum at recent industry events, it was caught in the crosscurrents of this widespread sector profit-taking.
From an institutional standpoint, today's intraday volatility reflects systemic macro headwinds and sector rotation rather than a breakdown in company-specific fundamentals. Cloud hyperscalers and enterprise customers continue to allocate significant capital toward AI infrastructure and data center buildouts, providing long-term support for advanced computing demand. Nevertheless, short-term price dynamics are likely to stay closely tied to macroeconomic indicators, interest rate expectations, and broader equity market sentiment.
Technical Analysis of NVIDIA Corp (NVDA)
Technically, NVIDIA Corp (NVDA) shows a MACD (12,26,9) value of -3.990, indicating a neutral signal. The RSI at 39.709 suggests neutral condition and the Williams %R at 99.085 suggests oversold condition. Please monitor closely.
Media Coverage of NVIDIA Corp (NVDA)
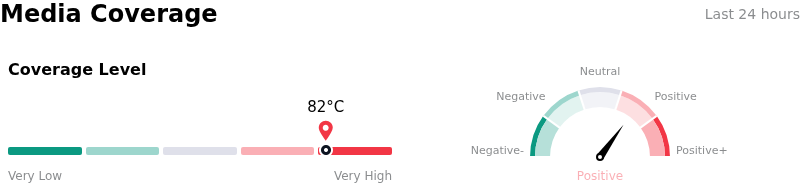
In terms of media coverage, NVIDIA Corp (NVDA) shows a coverage score of 82, indicating a very high level of media attention. The overall market sentiment index is currently in bullish zone.
Fundamental Analysis of NVIDIA Corp (NVDA)
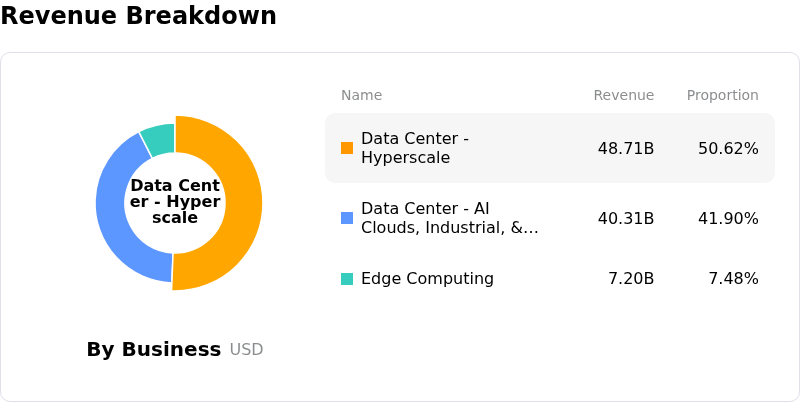
NVIDIA Corp (NVDA) is in the Technology Equipment industry. Its latest annual revenue is $215.94B, ranking 1 in the industry. The net profit is $120.07B, ranking 1 in the industry. Company Profile
Over the past month, multiple analysts have rated the company as Buy, with an average price target of $324.55, a high of $515.00, and a low of $180.00.
More details about NVIDIA Corp (NVDA)
Company Specific Risks:
- Counterparty Credit and AI Partner Balance Sheet Stress: Yields on debt issued by key AI cloud partner CoreWeave recently climbed to 15%, signaling acute financing stress among AI infrastructure builders. NVIDIA holds direct multi-billion-dollar balance sheet investments in partners such as CoreWeave and Nebius, meaning customer debt stress and potential credit bottlenecks directly threaten NVIDIA's equity valuations and future hardware purchasing liquidity.
- Hyperscaler Custom Silicon Disintermediation: Key cloud customers are accelerating the deployment of proprietary AI processors to reduce GPU reliance, highlighted by Microsoft introducing its Maia 300 inference chip that claims up to 40% higher power efficiency per megawatt over standard GPUs. This ongoing shift toward custom ASICs and open-weight model optimization threatens to erode NVIDIA’s data center market share and long-term pricing power.
- High Capital Expenditure Commitments and Packaging Supply Risks: Securing sufficient advanced packaging and substrate capacity for next-generation Vera Rubin systems has required NVIDIA to make massive financial commitments, including a $1.1 billion capacity reservation advance to test partner KYEC. These aggressive capital deployments expose NVIDIA to severe execution and margin risks if manufacturing partners experience operational delays.
- Valuation Compression and High Treasury Yield Vulnerability: U.S. 10-year Treasury yields hovering above 5% have exerted downward valuation pressure on mega-cap tech stocks, prompting institutional profit-taking. With trading activity exhibiting negative intraday momentum, prediction markets and market technicals reflect a 72% probability of a deeper pullback toward the $224 level.
Recommended Articles


