

XRP (XRPUSD) Is down 1.40% on Oct 22: What Are the Risk Factors?

Source Tradingkey

XRP (XRPUSD) is down 1.40% at Oct 22 20:00(ET), now at $1.3652, with a 7-day up of 1.94%.
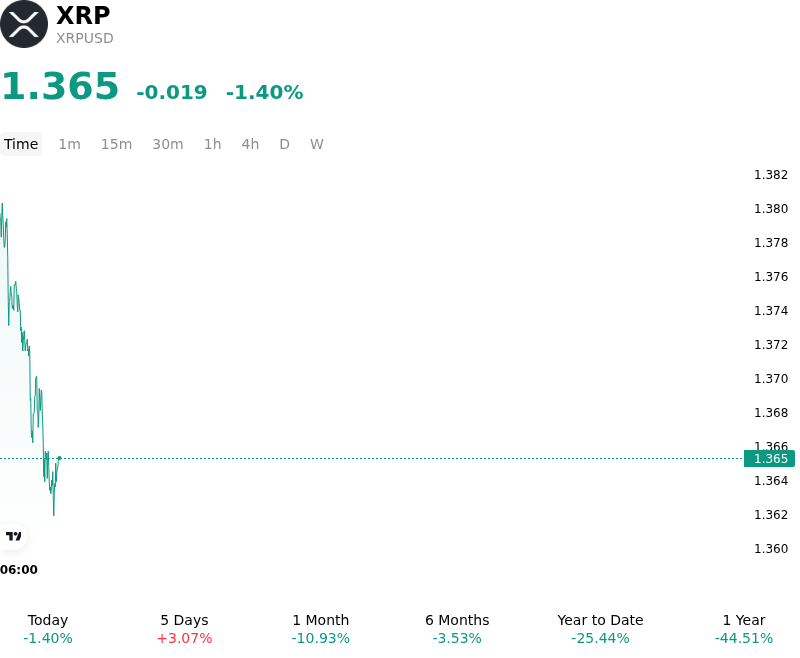
SummaryOverview

What is driving XRP (XRPUSD)’s stock price down today?

The pullback in XRP reflects broader macroeconomic caution and a temporary moderation in institutional spot exchange-traded fund demand. As crypto markets navigate sticky inflation concerns and shifting expectations surrounding Federal Reserve monetary policy, persistent yield volatility has restrained overall risk appetite across major altcoins. Concurrently, net capital inflows into spot XRP exchange-traded funds experienced a brief deceleration following weeks of sustained institutional accumulation, reducing the marginal buying volume required to absorb overhead supply. This reduction in spot demand left the asset susceptible to profit-taking after failing to clear major technical resistance boundaries.

Derivatives market mechanics and order book dynamics further amplified the downward pressure. A modest wave of long position liquidations occurred as short-term open interest adjusted, temporarily overpowering spot bids. While exchange balances have steadily trended downward due to ongoing institutional custody transfers and whale accumulation, spot market depth remained shallow during the trading session, making price action more sensitive to intraday liquidations. In addition, institutional investors remain attentive to long-term network fee mechanics and tokenized asset adoption, maintaining a disciplined valuation approach rather than chasing speculative price expansions.

Despite the temporary softness, XRP's broader structural framework continues to be supported by post-litigation regulatory clarity, expanding corporate treasury programs, and established spot ETF products. However, near-term price direction remains heavily dependent on macroeconomic liquidity conditions and a resurgence in ETF net creations. Investors continue to monitor Federal Reserve policy developments, institutional payment implementation, and derivatives positioning to evaluate whether the asset will re-establish upward momentum or remain confined to a broader consolidation range.

Technical Analysis of XRP (XRPUSD)

Technically, XRP (XRPUSD) shows a MACD (12,26,9) value of -0.003, indicating a sell signal. The RSI at 47.824 suggests neutral condition and the Williams %R at 36.406 suggests buy condition. Please monitor closely.
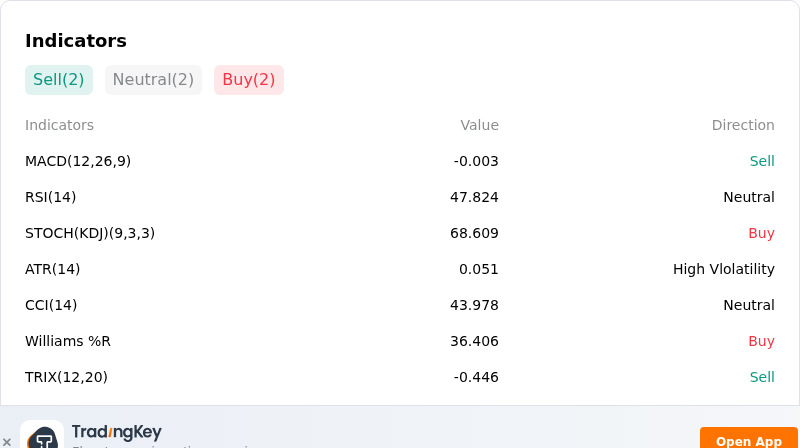
IndicatorAnalysis

More details about XRP (XRPUSD)

Recent Events and Risks:

  • Spot ETF Outflow Reversal: US-listed XRP spot ETFs recently ended a 13-week streak of continuous capital inflows by posting weekly net outflows, indicating a sudden freeze in institutional spot demand and removing a key driver of price support.
  • Derivatives Open Interest and Leverage Unwind: Open interest in XRP perpetual futures has contracted significantly alongside a 26% decline in leverage ratios on major exchanges like Binance, signaling reduced trader conviction and lower market depth to absorb downside volatility.
  • Elevated Exchange Supply Overhang: Exchange reserves have remained elevated near 11.8 billion XRP tokens, creating significant overhead sell pressure that risks triggering further liquidations if price breaches crucial technical support near $1.28 to $1.30.
  • Drop in On-Chain Payment Volume: Daily transactional volume on the XRP Ledger dropped over 70% below its 30-day average during recent sessions, highlighting a sharp drop in network activity and utility demand during price consolidation.
Disclaimer: For information purposes only. Past performance is not indicative of future results.
placeholder
Gold Price Analysis Today | Forex Gold Analysis | XAU/USD Analysis - October 20, 2026Get the latest gold price analysis, forex gold insights, and XAU/USD analysis for October 20, 2026. Read on for the details.
Author  Mitrade
Oct 20, Tue
Get the latest gold price analysis, forex gold insights, and XAU/USD analysis for October 20, 2026. Read on for the details.
placeholder
Dollar presses 102 as the 10-year yield sits at 5.14% — and October hike odds are only 17%The dollar index closed at 101.99 (+0.20%) on Monday after briefly topping 102.07, while the 10-year Treasury yield rose to 5.14% and the 2-year hit 4.774% — yet futures price only about a 17% chance of a hike at the October 27-28 FOMC, versus roughly 90% for December. The driver is a global bond selloff, not a Fed repricing: France's 10-year OAT jumped to 4.84% ~ 4.94% and the OAT-Bund spread widened to 140 ~ 146bp. Here are the levels, the cross-asset read-through and what to watch.
Author  Irene Q.
Oct 20, Tue
The dollar index closed at 101.99 (+0.20%) on Monday after briefly topping 102.07, while the 10-year Treasury yield rose to 5.14% and the 2-year hit 4.774% — yet futures price only about a 17% chance of a hike at the October 27-28 FOMC, versus roughly 90% for December. The driver is a global bond selloff, not a Fed repricing: France's 10-year OAT jumped to 4.84% ~ 4.94% and the OAT-Bund spread widened to 140 ~ 146bp. Here are the levels, the cross-asset read-through and what to watch.
placeholder
Tesla Q3 Earnings Preview: Can Auto Margins Stabilize? Wall Street’s Highest Price Target at $550Tesla (TSLA) will report its third-quarter 2026 financial results after the U.S. stock market close on October 21, Eastern Time, and host an earnings conference call at 17:30 that day. Th
Author  TradingKey
Oct 20, Tue
Tesla (TSLA) will report its third-quarter 2026 financial results after the U.S. stock market close on October 21, Eastern Time, and host an earnings conference call at 17:30 that day. Th
placeholder
Gold Price Analysis Today | Forex Gold Analysis | XAU/USD Analysis - October 21, 2026Get the latest gold price analysis, forex gold insights, and XAU/USD analysis for October 21, 2026. Read on for the details.
Author  Mitrade
Yesterday 02: 40
Get the latest gold price analysis, forex gold insights, and XAU/USD analysis for October 21, 2026. Read on for the details.
placeholder
The Dow gained 500 points and the two AI names that matter fell after hours — Netflix's guide is the tellThe Dow closed 529.85 points higher at 52,495.88 (+1.02%) and the VIX fell 6.13% to 17.31, but the two stocks that carry the AI trade moved the other way after Tuesday's close: Netflix slipped to $64.74 (-5.8%) after guiding Q4 EPS of $0.67, below the street, while SpaceX jumped about 8% to near $160 on its first profit as a public company and revenue up 161%. Netflix is now below its 52-week low of $65.08. Here are the numbers, the $65 / $70 levels and the two catalysts that matter this week.
Author  Irene Q.
20 hours ago
The Dow closed 529.85 points higher at 52,495.88 (+1.02%) and the VIX fell 6.13% to 17.31, but the two stocks that carry the AI trade moved the other way after Tuesday's close: Netflix slipped to $64.74 (-5.8%) after guiding Q4 EPS of $0.67, below the street, while SpaceX jumped about 8% to near $160 on its first profit as a public company and revenue up 161%. Netflix is now below its 52-week low of $65.08. Here are the numbers, the $65 / $70 levels and the two catalysts that matter this week.
goTop
quote