

BNB (BNBUSD) Suddenly Goes up 1.00% on Oct 21: What You Need to Watch

Source Tradingkey

BNB (BNBUSD) is up 1.00% at Oct 21 04:50(ET), now at $745.9, with a 7-day up of 2.74%.
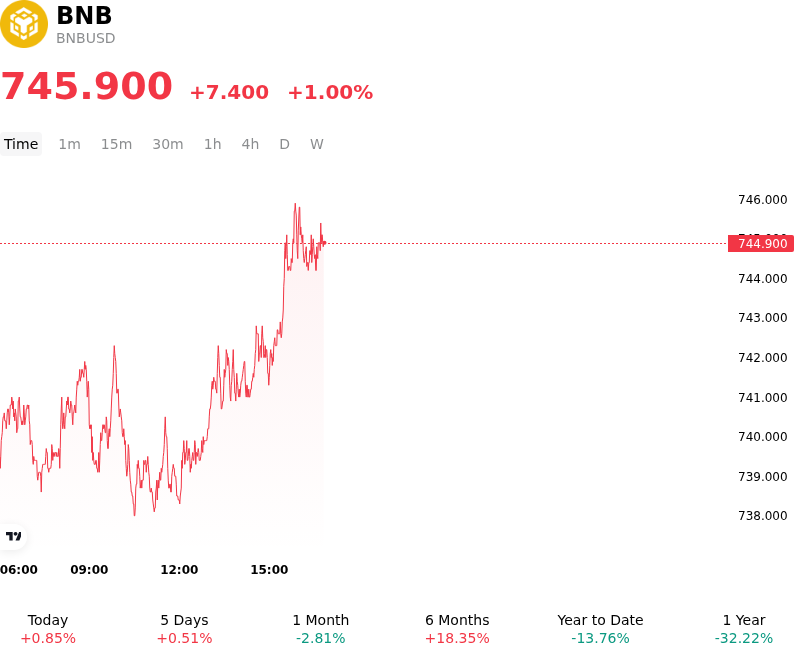
SummaryOverview

What is driving BNB (BNBUSD)’s stock price up today?

Capital flowed into BNB as market sentiment responded positively to supply-side tightening and sustained structural demand across the Binance ecosystem. A key driver behind the upward momentum was the ongoing tailwind from the execution of the 37th quarterly BNB auto-burn, which permanently removed roughly 1.65 million tokens valued at approximately 1.2 billion dollars from circulating supply. By executing the automated deflationary mechanism and shrinking the asset's total supply toward its long-term target, the burn reinforced scarcity dynamics among institutional and retail market participants, helping establish a firm price floor above key support levels.

Institutional demand was further supported by balance-sheet and corporate treasury developments, specifically surrounding major corporate treasury entities preparing for public capital market listings to scale institutional BNB holdings. Anticipation of structured institutional buying, combined with ongoing corporate treasury accumulation, improved medium-term liquidity expectations. Additionally, ecosystem developments around the high-throughput Layer-1 infrastructure designed for automated trading and payment applications—utilizing BNB as its sole gas asset—strengthened fundamental adoption expectations across decentralized finance and enterprise applications.

From a market structure perspective, the price advance reflected technical absorption of spot supply as traders pushed the asset back above immediate moving average cluster resistance. Derivatives positioning signaled measured risk-on rebalancing, with modest short covering taking place as spot accumulation offset broader market volatility. Although broader macroeconomic considerations—including U.S. Treasury yield movements and Federal Reserve monetary policy uncertainty—continue to impose selective headwinds on risk assets, BNB's specific deflationary catalysts and institutional treasury initiatives provided clear relative strength and capital inflows.

Technical Analysis of BNB (BNBUSD)

Technically, BNB (BNBUSD) shows a MACD (12,26,9) value of -3.524, indicating a sell signal. The RSI at 51.401 suggests neutral condition and the Williams %R at 41.679 suggests buy condition. Please monitor closely.
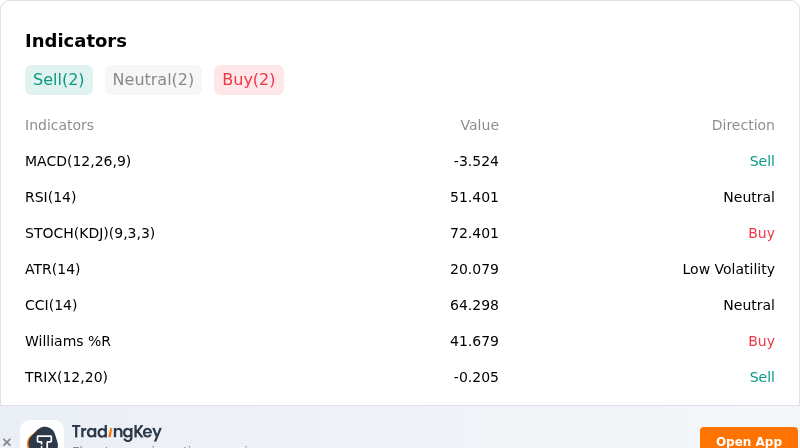
IndicatorAnalysis

More details about BNB (BNBUSD)

Recent Events and Risks:

  • Muted Post-Burn Rally and Overhead Technical Resistance: Following BNB Chain's 37th quarterly burn on October 19—which permanently removed 1.646 million BNB valued at approximately $1.197 billion from circulation—the price failed to spark a sustained bullish breakout. The token remains suppressed beneath key 20-day and 50-day moving average resistance levels between $735 and $750, heightening corrective risks toward primary support at $700.
  • Derivatives Unwinding and Long Liquidation Pressure: Market-wide liquidations of leveraged long positions across major digital assets have exerted strong downside pressure on BNB. Spot prices have repeatedly tested lower boundaries, pushing BNB below its 50-day exponential moving average and leaving long traders vulnerable to further liquidation cascades.
  • Exchange Liquidity Adjustments and Listing Scrutiny: Ongoing exchange risk management and token delisting schedules on Binance, alongside persistent regulatory compliance monitoring, have constrained speculative trading volume. Declining market depth and reduced liquidity in related ecosystem trading pairs have increased sensitivity to intraday sell orders.
  • Macro Risk-Off Sentiment and Geopolitical Spillovers: Elevated US Treasury yields, US dollar strength, and heightened geopolitical tensions in the Middle East have driven broad risk-off sentiment across global capital markets. This macro backdrop has prompted institutional traders to pare back risk assets and altcoin exposures, suppressing buying interest in BNB.
Disclaimer: For information purposes only. Past performance is not indicative of future results.
placeholder
Dollar presses 102 as the 10-year yield sits at 5.14% — and October hike odds are only 17%The dollar index closed at 101.99 (+0.20%) on Monday after briefly topping 102.07, while the 10-year Treasury yield rose to 5.14% and the 2-year hit 4.774% — yet futures price only about a 17% chance of a hike at the October 27-28 FOMC, versus roughly 90% for December. The driver is a global bond selloff, not a Fed repricing: France's 10-year OAT jumped to 4.84% ~ 4.94% and the OAT-Bund spread widened to 140 ~ 146bp. Here are the levels, the cross-asset read-through and what to watch.
Author  Irene Q.
Oct 20, Tue
The dollar index closed at 101.99 (+0.20%) on Monday after briefly topping 102.07, while the 10-year Treasury yield rose to 5.14% and the 2-year hit 4.774% — yet futures price only about a 17% chance of a hike at the October 27-28 FOMC, versus roughly 90% for December. The driver is a global bond selloff, not a Fed repricing: France's 10-year OAT jumped to 4.84% ~ 4.94% and the OAT-Bund spread widened to 140 ~ 146bp. Here are the levels, the cross-asset read-through and what to watch.
placeholder
Tesla Q3 Earnings Preview: Can Auto Margins Stabilize? Wall Street’s Highest Price Target at $550Tesla (TSLA) will report its third-quarter 2026 financial results after the U.S. stock market close on October 21, Eastern Time, and host an earnings conference call at 17:30 that day. Th
Author  TradingKey
Oct 20, Tue
Tesla (TSLA) will report its third-quarter 2026 financial results after the U.S. stock market close on October 21, Eastern Time, and host an earnings conference call at 17:30 that day. Th
placeholder
The Dow gained 500 points and the two AI names that matter fell after hours — Netflix's guide is the tellThe Dow closed 529.85 points higher at 52,495.88 (+1.02%) and the VIX fell 6.13% to 17.31, but the two stocks that carry the AI trade moved the other way after Tuesday's close: Netflix slipped to $64.74 (-5.8%) after guiding Q4 EPS of $0.67, below the street, while SpaceX jumped about 8% to near $160 on its first profit as a public company and revenue up 161%. Netflix is now below its 52-week low of $65.08. Here are the numbers, the $65 / $70 levels and the two catalysts that matter this week.
Author  Irene Q.
Yesterday 05: 56
The Dow closed 529.85 points higher at 52,495.88 (+1.02%) and the VIX fell 6.13% to 17.31, but the two stocks that carry the AI trade moved the other way after Tuesday's close: Netflix slipped to $64.74 (-5.8%) after guiding Q4 EPS of $0.67, below the street, while SpaceX jumped about 8% to near $160 on its first profit as a public company and revenue up 161%. Netflix is now below its 52-week low of $65.08. Here are the numbers, the $65 / $70 levels and the two catalysts that matter this week.
placeholder
Gold Price Analysis Today | Forex Gold Analysis | XAU/USD Analysis - October 22, 2026Get the latest gold price analysis, forex gold insights, and XAU/USD analysis for October 22, 2026. Read on for the details.
Author  Mitrade
6 hours ago
Get the latest gold price analysis, forex gold insights, and XAU/USD analysis for October 22, 2026. Read on for the details.
placeholder
The Fed will sit still on October 28 — but 100 of 100 economists now expect a December hikeA Reuters poll run October 16-20 found 94 of 100 economists expecting the Fed to hold at 3.75-4.00% on October 28 — and all 100 expecting a hike in December, against less than half a month earlier. The market is close to the same price, with CME FedWatch at roughly 17% for October and 82.8% for December. With the Fed in blackout since October 17, here are the five dates that decide the rest of the year, what each one is priced for, and the two directions each can take.
Author  Irene Q.
1 hour ago
A Reuters poll run October 16-20 found 94 of 100 economists expecting the Fed to hold at 3.75-4.00% on October 28 — and all 100 expecting a hike in December, against less than half a month earlier. The market is close to the same price, with CME FedWatch at roughly 17% for October and 82.8% for December. With the Fed in blackout since October 17, here are the five dates that decide the rest of the year, what each one is priced for, and the two directions each can take.
goTop
quote