

USD/MXN (USDMXN) Is up 0.50% on Oct 20: What Signals Does the Macro Data Send?

Source Tradingkey

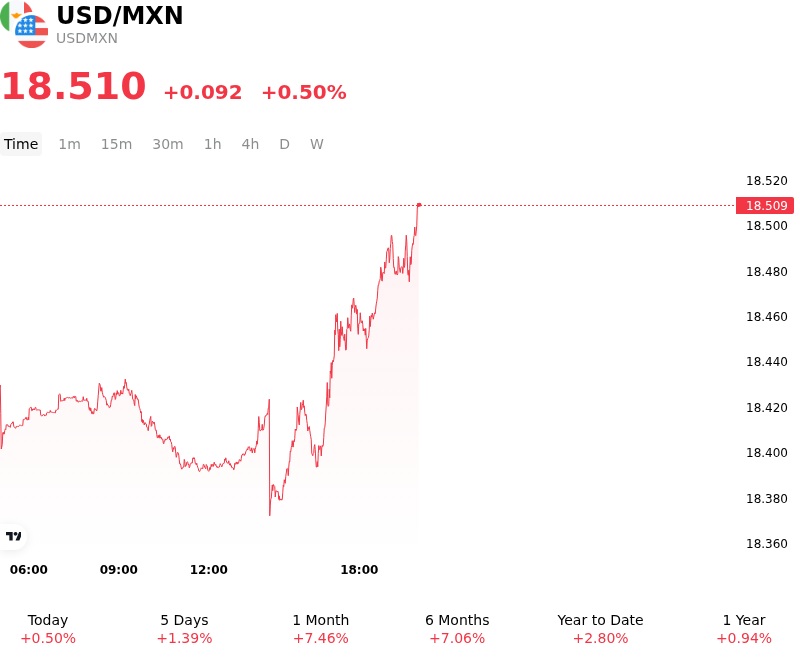
USD/MXN (USDMXN) is up 0.50% at Oct 20 08:00(ET), now at $18.50965, with a 7-day up of 0.81%.
SummaryOverview

What is driving USD/MXN (USDMXN)’s stock price up today?

The upward movement in USDMXN reflects a combination of renewed U.S. dollar strength driven by firm U.S. economic data and elevated U.S. Treasury yields, alongside softening appetite for high-yielding emerging market currencies. Front-end and benchmark U.S. Treasury yields pushed higher as institutional investors recalibrated expectations regarding the Federal Reserve's monetary policy path. Sticky U.S. inflation indicators and persistent economic resilience have prompted market participants to scale back near-term rate cut expectations, broadening U.S. dollar demand across major FX pairs.

On the domestic side, the Mexican peso underperformed as narrowing short-term interest rate differentials eroded the currency's carry-trade appeal. Although Banco de Mexico has maintained a cautious monetary stance around its benchmark rate to contain headline inflation risks, domestic growth momentum remains modest and economic slack persists. The reduced yield spread between Mexican and U.S. sovereign debt has curtailed institutional capital inflows into peso-denominated paper, leaving the currency vulnerable to shifting global capital flows and firming U.S. yields.

From a structural standpoint, the currency pair's advance is aligned with a broader macroeconomic adjustment rather than an isolated intraday noise event. Global risk sentiment faced headwinds from persistent geopolitical friction and energy market volatility, triggering defensive capital allocations toward safe-haven assets and away from Latin American currencies. Looking ahead, market participants will monitor upcoming U.S. macroeconomic releases, labor market data, and central bank communications for further signals on interest rate differentials and broader macro momentum.

Technical Analysis of USD/MXN (USDMXN)

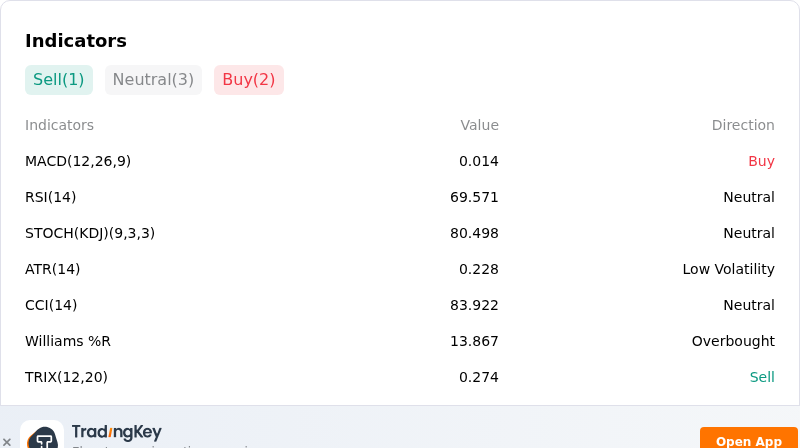
Technically, USD/MXN (USDMXN) shows a MACD (12,26,9) value of 0.014, indicating a buy signal. The RSI at 69.571 suggests neutral condition and the Williams %R at 13.867 suggests overbought condition. Please monitor closely.
IndicatorAnalysis

More details about USD/MXN (USDMXN)

Recent Events and Risks:

  • Stalled Bilateral Trade Talks and Tariff Friction: Progress on U.S.-Mexico trade negotiations has stalled over unresolved 25% tariffs on Mexican autos and 50% levies on steel and aluminum, alongside persistent U.S. policy pressure on domestic energy investment, injecting renewed bilateral trade risk into USD/MXN.
  • Carry Trade Unwind from Narrowing Rate Spread: The Mexican peso's high-yield appeal continues to weaken as resilient U.S. Treasury yields contrast with Banxico's interest rate hold, accelerating the reduction of carry trade positioning and fueling upside volatility in USD/MXN.
  • Dovish Banxico Signals and Policy Divergence: Bank of Mexico meeting minutes revealed that several board members remain open to resuming rate cuts if inflation trends lower, creating monetary policy divergence risks against a hawkish Federal Reserve stance and keeping the peso under downside pressure.
  • Macro Event Risk Surrounding Imminent Economic Data: Market participants face heightened intraday volatility ahead of upcoming Mexican mid-month inflation and retail sales data releases, where any weakness in local macro figures risks triggering further peso depreciation.
Disclaimer: For information purposes only. Past performance is not indicative of future results.
placeholder
Gold Price Analysis Today | Forex Gold Analysis | XAU/USD Analysis - October 19, 2026Get the latest gold price analysis, forex gold insights, and XAU/USD analysis for October 19, 2026. Read on for the details.
Author  Mitrade
Yesterday 02: 11
Get the latest gold price analysis, forex gold insights, and XAU/USD analysis for October 19, 2026. Read on for the details.
placeholder
Gold retests $4,200 as dollar and yields retreat — can bullion clear its hardest level?Spot gold traded near $4,175 on Monday (+0.23%), with an intraday high of $4,187.71 after last week's $4,073 ~ $4,217 range; COMEX futures briefly topped $4,200. The dollar slipped to 101.76 and 10-year yields eased from their highs, but October Fed hike odds near 52% and BofA's sub-$4,000 call still cap the upside. Here are the drivers, the levels and what would flip the script.
Author  Irene Q.
Yesterday 06: 25
Spot gold traded near $4,175 on Monday (+0.23%), with an intraday high of $4,187.71 after last week's $4,073 ~ $4,217 range; COMEX futures briefly topped $4,200. The dollar slipped to 101.76 and 10-year yields eased from their highs, but October Fed hike odds near 52% and BofA's sub-$4,000 call still cap the upside. Here are the drivers, the levels and what would flip the script.
placeholder
Brent slips from $110 as Russian supply prospects return — is the five-month rally over?Brent crude traded near $108.06 on Monday (-1.71%), pulling back from last week's $110 high after Washington moved to ease restrictions on Russian oil flows. WTI hovered around $101 before dipping below $99. The retreat is real, but so is the supply-risk premium: Hormuz shipping disruptions, attacks on Saudi energy infrastructure and strikes on Russian refineries remain live. Here are the three numbers, the transmission chain and the levels that matter.
Author  Irene Q.
Yesterday 06: 30
Brent crude traded near $108.06 on Monday (-1.71%), pulling back from last week's $110 high after Washington moved to ease restrictions on Russian oil flows. WTI hovered around $101 before dipping below $99. The retreat is real, but so is the supply-risk premium: Hormuz shipping disruptions, attacks on Saudi energy infrastructure and strikes on Russian refineries remain live. Here are the three numbers, the transmission chain and the levels that matter.
placeholder
Gold Price Analysis Today | Forex Gold Analysis | XAU/USD Analysis - October 20, 2026Get the latest gold price analysis, forex gold insights, and XAU/USD analysis for October 20, 2026. Read on for the details.
Author  Mitrade
9 hours ago
Get the latest gold price analysis, forex gold insights, and XAU/USD analysis for October 20, 2026. Read on for the details.
placeholder
Dollar presses 102 as the 10-year yield sits at 5.14% — and October hike odds are only 17%The dollar index closed at 101.99 (+0.20%) on Monday after briefly topping 102.07, while the 10-year Treasury yield rose to 5.14% and the 2-year hit 4.774% — yet futures price only about a 17% chance of a hike at the October 27-28 FOMC, versus roughly 90% for December. The driver is a global bond selloff, not a Fed repricing: France's 10-year OAT jumped to 4.84% ~ 4.94% and the OAT-Bund spread widened to 140 ~ 146bp. Here are the levels, the cross-asset read-through and what to watch.
Author  Irene Q.
7 hours ago
The dollar index closed at 101.99 (+0.20%) on Monday after briefly topping 102.07, while the 10-year Treasury yield rose to 5.14% and the 2-year hit 4.774% — yet futures price only about a 17% chance of a hike at the October 27-28 FOMC, versus roughly 90% for December. The driver is a global bond selloff, not a Fed repricing: France's 10-year OAT jumped to 4.84% ~ 4.94% and the OAT-Bund spread widened to 140 ~ 146bp. Here are the levels, the cross-asset read-through and what to watch.
goTop
quote