


XLK vs. SOXX: Broad Tech Exposure or Semiconductor Bet?
Key Points
State Street Technology Select Sector SPDR ETF has a lower expense ratio than iShares Semiconductor ETF.
The iShares fund delivered higher one-year total returns of 79.5% but experienced a steeper 45.8% max drawdown.
State Street's ETF offers a higher dividend yield and manages significantly more assets under management.
- Motley Fool Issues Rare "Total Conviction" Buy Alert ›
State Street Technology Select Sector SPDR ETF (NYSEMKT:XLK) offers broad, lower-cost exposure to the technology sector, while iShares Semiconductor ETF (NASDAQ:SOXX) provides a concentrated, higher-volatility play specifically on the chip industry.
Technology has been the primary engine of equity returns for several years, but the sector is far from a monolith. Investors often weigh the benefits of broad tech exposure against a concentrated bet on the hardware driving modern innovation. This comparison explores the differences between a diversified industry leader and a specialized thematic fund.
Snapshot (cost & size)
| Metric | SOXX | XLK |
|---|---|---|
| Issuer | iShares | SPDR |
| Share price (as of Oct. 15, 2026) | $514.71 | $189.19 |
| Expense ratio | 0.33% | 0.08% |
| 1-year return (as of Oct. 15, 2026) | 79.5% | 33.8% |
| Dividend yield | 0.2% | 0.5% |
| Beta | 1.83 | 1.34 |
| AUM | $42.7 billion | $125.6 billion |
Beta measures price volatility relative to the S&P 500; beta is calculated from monthly returns over the available fund history (up to five years). The 1-year return represents total return over the trailing 12 months. Dividend yield is the trailing-12-month distribution yield.
The State Street fund is significantly more affordable, with an expense ratio that is 0.25 percentage points lower than its iShares counterpart. Additionally, investors looking for income may find the State Street fund more appealing, as it currently offers a higher yield.
Performance & risk comparison
| Metric | SOXX | XLK |
|---|---|---|
| Max drawdown (5 year) | (45.8%) | (33.6%) |
| Growth of $1,000 over 5 years (total return) | $3,531 | $2,518 |
What's inside
The State Street ETF tracks the Technology Select Sector Index and is 100% focused on the technology sector. It holds 75 different positions, providing broader diversification than many sub-sector funds. Its largest positions include Nvidia (NASDAQ:NVDA) at 15.20%, Apple (NASDAQ:AAPL) at 14.43%, and Microsoft (NASDAQ:MSFT) at 11.58%. This fund was launched in 1998. XLK has paid $0.83 per share over the trailing 12 months.
The iShares fund targets a more specific niche, holding 30 of the largest U.S.-listed semiconductor companies. Its sector allocation is 82% in semiconductors and 18% in semiconductor equipment. Top holdings include Advanced Micro Devices (NASDAQ:AMD) at 9.42%, Intel (NASDAQ:INTC) at 8.40%, and Nvidia at 7.76%. This fund was launched in 2001. SOXX has paid $1.25 per share over the trailing 12 months.
For more guidance on ETF investing, check out the full guide at this link.
Which looks like the better buy?
The State Street ETF looks more attractive to me in this head-to-head matchup. For one, it has a lower expense ratio. It pays a slightly higher dividend. XLK also has a lower beta, and its five-year max drawdown is not quite as steep. The fund also has more positions in the portfolio, and I like that increased diversification. Additionally, XLK has considerably more assets under management.
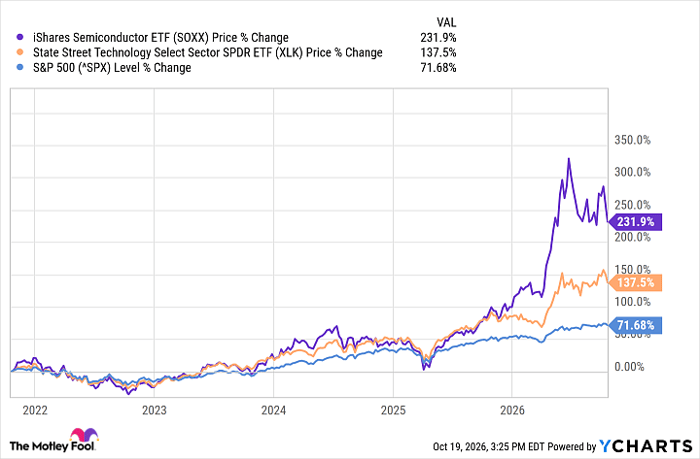
In contrast, SOXX cannot claim any of that. However, it has posted better returns than XLK both recently and over the past five years. Past performance is no indication of future results, but it never hurts to look at an ETF's track record.
Both ETFs have handily outperformed the S&P 500 over the past five years.
SOXX data by YCharts
I'm inclined to pick XLK here. It has lower returns, sure, but I like that it has a more diversified portfolio.
Should you buy stock in Select Sector SPDR Trust - State Street Technology Select Sector SPDR ETF right now?
Before you buy stock in Select Sector SPDR Trust - State Street Technology Select Sector SPDR ETF, consider this:
The Motley Fool Stock Advisor analyst team just identified what they believe are the 10 best stocks for investors to buy now… and Select Sector SPDR Trust - State Street Technology Select Sector SPDR ETF wasn’t one of them. The 10 stocks that made the cut could produce monster returns in the coming years.
Consider when Netflix made this list on December 17, 2004... if you invested $1,000 at the time of our recommendation, you’d have $380,363!* Or when Nvidia made this list on April 15, 2005... if you invested $1,000 at the time of our recommendation, you’d have $1,315,732!*
Now, it’s worth noting Stock Advisor’s total average return is 919% — a market-crushing outperformance compared to 211% for the S&P 500. Don't miss the latest top 10 list, available with Stock Advisor, and join an investing community built by individual investors for individual investors.
See the 10 stocks »
*Stock Advisor returns as of October 20, 2026.
Erin Kennedy has positions in Apple. The Motley Fool has positions in and recommends Advanced Micro Devices, Apple, Intel, Microsoft, Nvidia, and iShares Semiconductor ETF. The Motley Fool has a disclosure policy.
Recommended Articles


