

Natural Gas - Futures (NATGAS-F) Is down 2.25% on Oct 18: What Changed in Supply and Demand?

Source Tradingkey

Natural Gas - Futures (NATGAS-F) is down 2.25% at Oct 18 18:15(ET), now at $3.039, with a 7-day down of 4.88%.
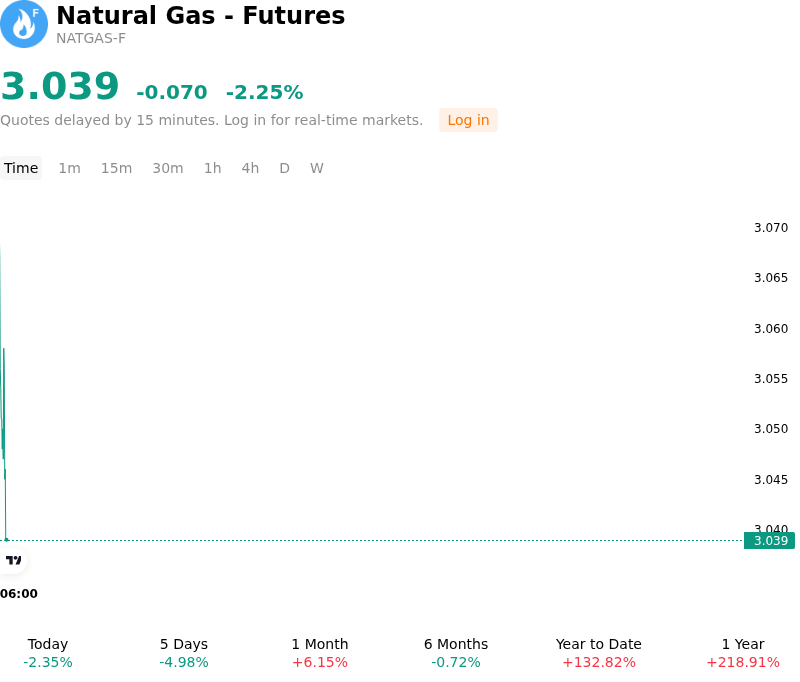
SummaryOverview

What is driving Natural Gas - Futures (NATGAS-F)’s stock price down today?

The decline in natural gas futures was primarily driven by updated weather forecasts projecting above-normal temperatures across major domestic heating regions. Mild autumn weather across key population centers in the Midwest and Eastern Seaboard has kept heating degree days depressed, effectively postponing the onset of winter space-heating demand. As the peak shoulder season transitions toward the winter heating cycle, delayed space-heating consumption prompted market participants to revise near-term domestic burn expectations lower, putting immediate downward pressure on prompt-month contract pricing.

On the supply side, downward price pressure was compounded by a gradual recovery in daily dry gas production as temporary pipeline maintenance bottlenecks and regional shut-ins began to clear. With Lower-48 output trending higher off recent temporary lows, physical spot markets experienced reduced localized tightness. Furthermore, while recent weekly inventory builds have run below historical averages, total underground storage reserves remain adequately capitalized near seasonal norms. This comfortable inventory buffer heading into late October reduces the immediate urgency for precautionary buying in the spot and front-month futures markets.

Looking ahead, the natural gas complex remains caught in a delicate seasonal balance ahead of contract expiration. While elevated liquefied natural gas feedgas demand and steady international export pull provide a strong structural floor for underlying consumption, near-term pricing remains firmly tethered to weather trajectories. Investors continue to closely monitor evolving November weather models, late-stage storage injection totals, and Gulf Coast export terminal intake for the next catalyst capable of triggering a sustained winter risk premium.

Technical Analysis of Natural Gas - Futures (NATGAS-F)

Technically, Natural Gas - Futures (NATGAS-F) shows a MACD (12,26,9) value of 0.003, indicating a buy signal. The RSI at 51.317 suggests neutral condition and the Williams %R at 51.306 suggests neutral condition. Please monitor closely.
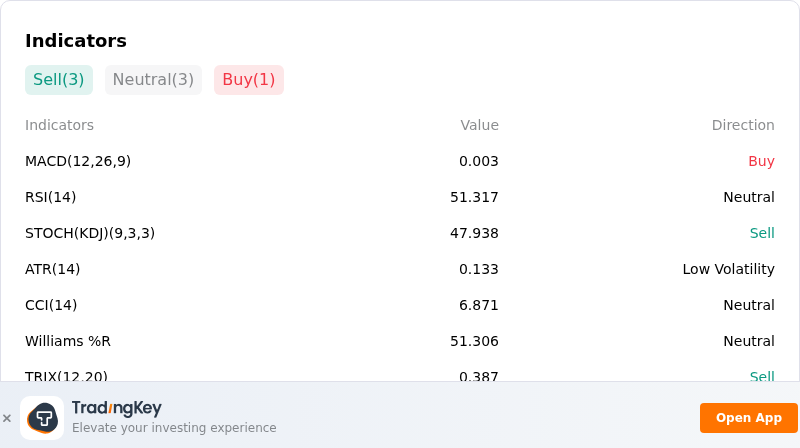
IndicatorAnalysis

More details about Natural Gas - Futures (NATGAS-F)

Recent Events and Risks:

  • Unseasonably Mild Weather Forecasts: Meteorological models from Commodity Weather Group and NatGasWeather project above-normal temperatures across the central and eastern United States through late October, severely curbing space heating demand during the seasonal transition.
  • Production Recovery and Pipeline Outage Resolutions: U.S. Lower-48 dry natural gas output rebounded to 113.9 Bcf/d, while expected completions of Columbia Gas Transmission (TCO) pipeline repairs are restoring Appalachian flows, increasing prompt supply into spot markets.
  • Substantial Underground Storage Cushion: Total U.S. working natural gas storage reached 3,567 Bcf, standing 1.3% above the five-year seasonal average, with government projections indicating end-of-October inventories could reach 3,985 Bcf and erode near-term supply tightness premiums.
  • Technical Support Breakdown and Long Liquidation: NYMEX November natural gas futures broke below key support at $3.09 following repeated rejections near $3.32 resistance, accelerating speculative long liquidation across prompt-month and winter futures strips.
Disclaimer: For information purposes only. Past performance is not indicative of future results.
placeholder
Gold Price Analysis Today | Forex Gold Analysis | XAU/USD Analysis - October 19, 2026Get the latest gold price analysis, forex gold insights, and XAU/USD analysis for October 19, 2026. Read on for the details.
Author  Mitrade
Yesterday 02: 11
Get the latest gold price analysis, forex gold insights, and XAU/USD analysis for October 19, 2026. Read on for the details.
placeholder
Gold retests $4,200 as dollar and yields retreat — can bullion clear its hardest level?Spot gold traded near $4,175 on Monday (+0.23%), with an intraday high of $4,187.71 after last week's $4,073 ~ $4,217 range; COMEX futures briefly topped $4,200. The dollar slipped to 101.76 and 10-year yields eased from their highs, but October Fed hike odds near 52% and BofA's sub-$4,000 call still cap the upside. Here are the drivers, the levels and what would flip the script.
Author  Irene Q.
Yesterday 06: 25
Spot gold traded near $4,175 on Monday (+0.23%), with an intraday high of $4,187.71 after last week's $4,073 ~ $4,217 range; COMEX futures briefly topped $4,200. The dollar slipped to 101.76 and 10-year yields eased from their highs, but October Fed hike odds near 52% and BofA's sub-$4,000 call still cap the upside. Here are the drivers, the levels and what would flip the script.
placeholder
Brent slips from $110 as Russian supply prospects return — is the five-month rally over?Brent crude traded near $108.06 on Monday (-1.71%), pulling back from last week's $110 high after Washington moved to ease restrictions on Russian oil flows. WTI hovered around $101 before dipping below $99. The retreat is real, but so is the supply-risk premium: Hormuz shipping disruptions, attacks on Saudi energy infrastructure and strikes on Russian refineries remain live. Here are the three numbers, the transmission chain and the levels that matter.
Author  Irene Q.
Yesterday 06: 30
Brent crude traded near $108.06 on Monday (-1.71%), pulling back from last week's $110 high after Washington moved to ease restrictions on Russian oil flows. WTI hovered around $101 before dipping below $99. The retreat is real, but so is the supply-risk premium: Hormuz shipping disruptions, attacks on Saudi energy infrastructure and strikes on Russian refineries remain live. Here are the three numbers, the transmission chain and the levels that matter.
placeholder
Gold Price Analysis Today | Forex Gold Analysis | XAU/USD Analysis - October 20, 2026Get the latest gold price analysis, forex gold insights, and XAU/USD analysis for October 20, 2026. Read on for the details.
Author  Mitrade
10 hours ago
Get the latest gold price analysis, forex gold insights, and XAU/USD analysis for October 20, 2026. Read on for the details.
placeholder
Dollar presses 102 as the 10-year yield sits at 5.14% — and October hike odds are only 17%The dollar index closed at 101.99 (+0.20%) on Monday after briefly topping 102.07, while the 10-year Treasury yield rose to 5.14% and the 2-year hit 4.774% — yet futures price only about a 17% chance of a hike at the October 27-28 FOMC, versus roughly 90% for December. The driver is a global bond selloff, not a Fed repricing: France's 10-year OAT jumped to 4.84% ~ 4.94% and the OAT-Bund spread widened to 140 ~ 146bp. Here are the levels, the cross-asset read-through and what to watch.
Author  Irene Q.
8 hours ago
The dollar index closed at 101.99 (+0.20%) on Monday after briefly topping 102.07, while the 10-year Treasury yield rose to 5.14% and the 2-year hit 4.774% — yet futures price only about a 17% chance of a hike at the October 27-28 FOMC, versus roughly 90% for December. The driver is a global bond selloff, not a Fed repricing: France's 10-year OAT jumped to 4.84% ~ 4.94% and the OAT-Bund spread widened to 140 ~ 146bp. Here are the levels, the cross-asset read-through and what to watch.
goTop
quote