

USD/CHF (USDCHF) Drops 0.51% on Oct 15: What Does the Market Value?

Source Tradingkey

USD/CHF (USDCHF) is down 0.51% at Oct 15 20:35(ET), now at $0.83054, with a 7-day down of 0.12%.
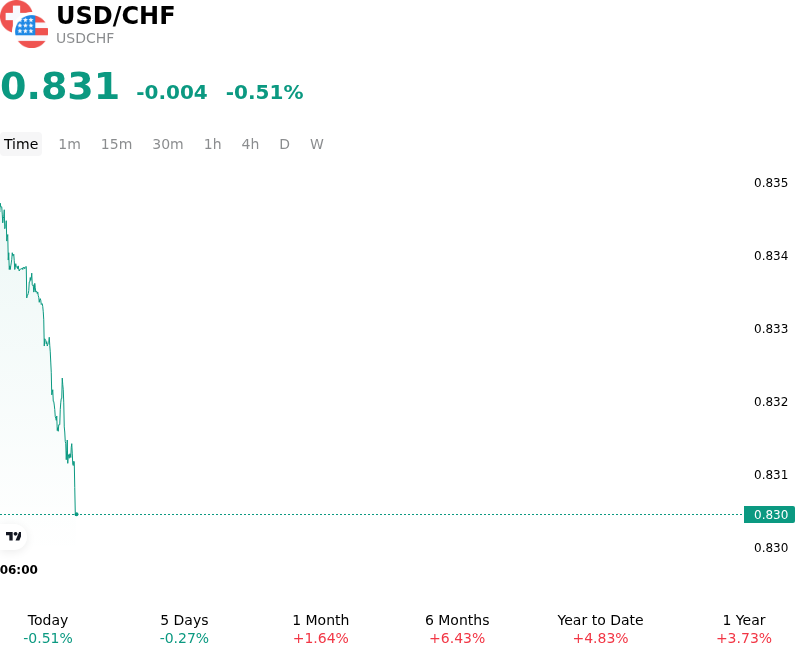
SummaryOverview

What is driving USD/CHF (USDCHF)’s stock price down today?

The pullback in USDCHF was primarily driven by a temporary retrenchment in U.S. Treasury yields and profit-taking on long U.S. dollar positions following a prolonged upward trajectory. After testing upper technical resistance levels, the greenback faced selling pressure as fixed-income markets paused their aggressive repricing of Federal Reserve interest rate expectations. A slight decline in long-term benchmark yields reduced the immediate yield advantage of the dollar, leading institutional investors to trim long exposure ahead of key U.S. macroeconomic releases.

On the other side of the pair, the Swiss franc experienced renewed capital inflows due to heightened safe-haven demand and a partial unwind of carry-trade positioning. Ongoing geopolitical tensions in the Middle East alongside emerging fiscal concerns across European sovereign debt markets increased risk aversion across global trading desks. Even though the Swiss National Bank maintains a dovish monetary policy setting underpinned by subdued domestic inflation and low interest rates, the franc's low-beta status made it an attractive destination for capital seeking shelter from equity and bond market volatility.

From a macro perspective, the downside move in USDCHF appears to be an event-driven tactical adjustment rather than a structural reversal of the broader macroeconomic trend. The fundamental policy divergence between the Federal Reserve's restrictive stance and the Swiss National Bank's accommodative policy framework continues to provide underlying support for the pair over a longer horizon. Investors will remain focused on incoming U.S. price indicators, Treasury yield trajectories, and global geopolitical sentiment to determine whether this pullback provides a renewed entry point for long dollar strategies or signals a broader consolidation phase.

Technical Analysis of USD/CHF (USDCHF)

Technically, USD/CHF (USDCHF) shows a MACD (12,26,9) value of -0.001, indicating a neutral signal. The RSI at 57.011 suggests neutral condition and the Williams %R at 49.762 suggests neutral condition. Please monitor closely.
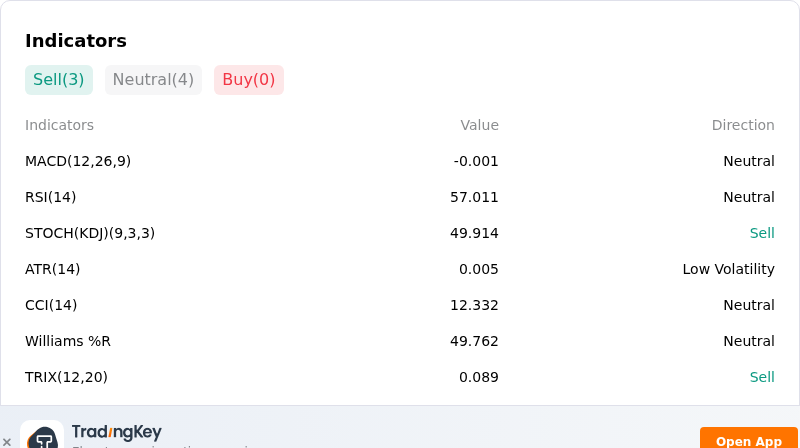
IndicatorAnalysis

More details about USD/CHF (USDCHF)

Recent Events and Risks:

  • Safe-Haven CHF Capital Inflows: Intensified geopolitical volatility in the Middle East alongside European fiscal debt concerns have fueled defensive capital flows into the Swiss Franc, generating sudden intraday downside pressure on the USD/CHF pair.
  • US Macro Softening and Dovish Repricing: Recent pullbacks in US consumer sentiment metrics and weaker employment data have tempered expectations for sustained Federal Reserve rate hikes, leaving the US Dollar prone to sharp downside retracements against defensive currencies.
  • Carry Trade Liquidity Squeezes: Rapid yield curve adjustments in fixed-income markets combined with overbought short-term technical indicators increase the probability of CHF-funded carry trade unwinds, exposing USD/CHF to sudden liquidity shocks and stop-loss driven sell-offs.
  • European Yield Volatility Spillovers: Surging European government bond yields and sovereign debt concerns continue to highlight Switzerland's low fiscal risk profile, prompting institutional traders to hedge via long CHF allocations.
Disclaimer: For information purposes only. Past performance is not indicative of future results.
placeholder
October hike odds climb toward 60% as Goldman and BofA both flip — what Warsh's "dose of accommodation" really changedRate futures now price roughly 55% to 62% for a 25bp hike at the October 27-28 FOMC, up from about 30% before Chair Warsh's post-meeting framing that the Fed is merely "removing some accommodation." Goldman Sachs has added an October hike to its forecast and Bank of America now sees moves in both October and December. Here is the repricing, the language behind it, and the two data points that decide it.
Author  Irene Q.
Sep 23, Wed
Rate futures now price roughly 55% to 62% for a 25bp hike at the October 27-28 FOMC, up from about 30% before Chair Warsh's post-meeting framing that the Fed is merely "removing some accommodation." Goldman Sachs has added an October hike to its forecast and Bank of America now sees moves in both October and December. Here is the repricing, the language behind it, and the two data points that decide it.
placeholder
Strong profits, falling shares: bank earnings day one meets a memory-chip rout — with CPI and ASML aheadGoldman Sachs blew past estimates (EPS $17.01 vs $13.09 expected, profit +33%) while JPMorgan missed ($5.75 vs $5.93) and Wells Fargo fell 3% — yet the S&P 500 finished flat at 7,805.45, pinned below its record close as a memory-chip rout (SOX −2.67%, Micron under $1,000) kept the pressure on. Tonight brings the week's decider: US September CPI at 8:30 ET, then Bank of America, Morgan Stanley, BlackRock and ASML before the open. Here are the levels, both cases, and the watch list.
Author  Irene Q.
Oct 14, Wed
Goldman Sachs blew past estimates (EPS $17.01 vs $13.09 expected, profit +33%) while JPMorgan missed ($5.75 vs $5.93) and Wells Fargo fell 3% — yet the S&P 500 finished flat at 7,805.45, pinned below its record close as a memory-chip rout (SOX −2.67%, Micron under $1,000) kept the pressure on. Tonight brings the week's decider: US September CPI at 8:30 ET, then Bank of America, Morgan Stanley, BlackRock and ASML before the open. Here are the levels, both cases, and the watch list.
placeholder
US September CPI recap: inflation hits 3.7% as core runs hot — is an October Fed hike back on the table?September CPI landed hot: headline 3.7% y/y, core 2.6% y/y and 0.3% m/m. October hike odds jumped from ~22% to ~37% — yet the dollar faded to 101.74, gold closed higher and the S&P 500 fell 1.11%. Here is the full repricing, the levels and what to watch next.
Author  Irene Q.
Yesterday 05: 52
September CPI landed hot: headline 3.7% y/y, core 2.6% y/y and 0.3% m/m. October hike odds jumped from ~22% to ~37% — yet the dollar faded to 101.74, gold closed higher and the S&P 500 fell 1.11%. Here is the full repricing, the levels and what to watch next.
placeholder
Gold defends $4,100 as BofA targets a break below $4,000 — why the Middle East bid is missingSpot gold flushed to $4,099.89, a whisker above October's $4,090 low, then rebounded to close at $4,138.25 (+0.82%) — even as US CPI ran hot. Bank of America sees gold below $4,000 within three months, citing shrinking demand and official-sector selling. Here are the levels, the drivers and what would flip the script.
Author  Irene Q.
Yesterday 06: 57
Spot gold flushed to $4,099.89, a whisker above October's $4,090 low, then rebounded to close at $4,138.25 (+0.82%) — even as US CPI ran hot. Bank of America sees gold below $4,000 within three months, citing shrinking demand and official-sector selling. Here are the levels, the drivers and what would flip the script.
placeholder
Gold Price Analysis Today | Forex Gold Analysis | XAU/USD Analysis - October 15, 2026Get the latest gold price analysis, forex gold insights, and XAU/USD analysis for October 15, 2026. Read on for the details.
Author  Mitrade
Yesterday 07: 01
Get the latest gold price analysis, forex gold insights, and XAU/USD analysis for October 15, 2026. Read on for the details.
goTop
quote