


AbbVie Inc Stock (ABBV) Moved Up by 3.36% on Oct 14: A Full Analysis
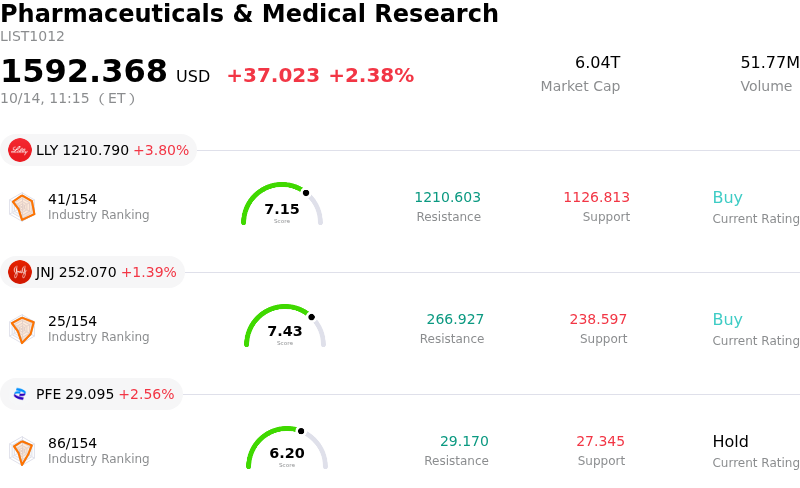
AbbVie Inc (ABBV) moved up by 3.36%. The Pharmaceuticals & Medical Research sector is up by 2.38%. The company outperformed the industry. Top 3 stocks by turnover in the sector: Eli Lilly and Co (LLY) up 3.80%; Johnson & Johnson (JNJ) up 1.39%; Pfizer Inc (PFE) up 2.56%.
What is driving AbbVie Inc (ABBV)’s stock price up today?
AbbVie witnessed notable upward momentum with significant intraday volatility as positive clinical updates from its core immunology franchise bolstered investor confidence. The biopharmaceutical giant presented detailed Phase 3 AFFIRM study data at the American College of Gastroenterology annual meeting, demonstrating robust clinical and endoscopic outcomes for subcutaneous Skyrizi in patients with Crohn's disease. These findings reinforced expectations that expanding indications for Skyrizi and Rinvoq will continue to effectively absorb revenue erosion from legacy blockbuster Humira, supporting long-term commercial durability in inflammatory bowel disease.
Market sentiment was further supported by favorable Wall Street commentary and institutional positioning ahead of the company's upcoming quarterly earnings release. Research analysts have reaffirmed bullish ratings and adjusted price targets upward, pointing to strong execution across immunology, neuroscience, and oncology, as well as the commercial potential of recent strategic acquisitions. Added buying interest around the company's dividend schedule also provided steady fundamental support, appealing to income-oriented investors seeking portfolio defense.
Despite the bullish momentum pushing the stock toward historic high levels during the session, intraday fluctuations highlighted ongoing valuation debates. With the stock trading at a premium multiple relative to historical averages, market participants remain watchful of potential margin pressures from competitive immunology therapies, government pricing regulations, and integration costs from major deals. Nevertheless, strong prescription trends for core growth drivers continue to outweigh near-term risks, driving sustained institutional support.
Technical Analysis of AbbVie Inc (ABBV)
Technically, AbbVie Inc (ABBV) shows a MACD (12,26,9) value of 3.056, indicating a buy signal. The RSI at 69.754 suggests neutral condition and the Williams %R at 0.503 suggests overbought condition. Please monitor closely.
Media Coverage of AbbVie Inc (ABBV)
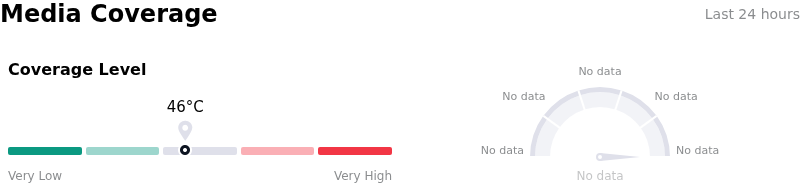
In terms of media coverage, AbbVie Inc (ABBV) shows a coverage score of 46, indicating a moderate level of media attention. The overall market sentiment index is currently in extremely bullish zone.
Fundamental Analysis of AbbVie Inc (ABBV)
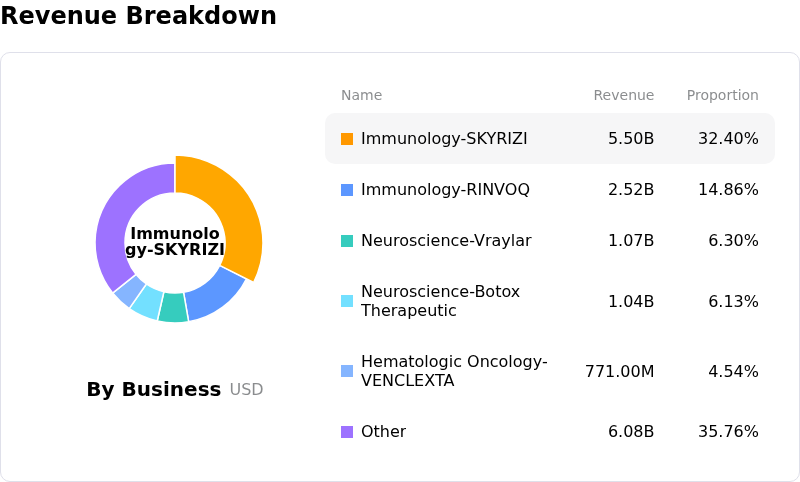
AbbVie Inc (ABBV) is in the Pharmaceuticals & Medical Research industry. Its latest annual revenue is $61.16B, ranking 7 in the industry. The net profit is $4.19B, ranking 15 in the industry. Company Profile
Over the past month, multiple analysts have rated the company as Buy, with an average price target of $281.30, a high of $328.00, and a low of $197.05.
More details about AbbVie Inc (ABBV)
Company Specific Risks:
- Guidance Downgrades and Acquired R&D Expenses: AbbVie's financial performance faces near-term earnings dilution from repeated acquired in-process R&D (IPR&D) and milestone charges, which have forced management to revise full-year adjusted EPS guidance downward and pressure quarterly profit margins.
- Accelerated Humira Revenue Erosion: Ongoing market share loss and steep double-digit revenue declines in legacy blockbuster Humira due to expanding biosimilar competition continue to drag on top-line stability, increasing the enterprise's reliance on flawless execution across key replacement therapies.
- Pipeline Failure and Asset Impairment Risk: High-profile clinical trial setbacks, such as the Phase 2 EMPOWER trial failure for schizophrenia candidate emraclidine, highlight elevated execution risks in AbbVie's high-cost acquired CNS and oncology pipeline assets.
- Demanding Valuation and Overbought Profit-Taking: With the stock trading at a high earnings multiple near historical highs, technical overbought conditions have exposed shares to sharp intraday volatility and profit-taking sell-offs.
Recommended Articles


