


ASML Holding NV Stock (ASML) Moved Down by 3.09% on Oct 13: A Full Analysis
ASML Holding NV (ASML) moved down by 3.09%. The Technology Equipment sector is down by 0.48%. The company underperformed the industry. Top 3 stocks by turnover in the sector: Micron Technology Inc (MU) down 5.11%; Apple Inc (AAPL) up 0.80%; NVIDIA Corp (NVDA) up 0.49%.
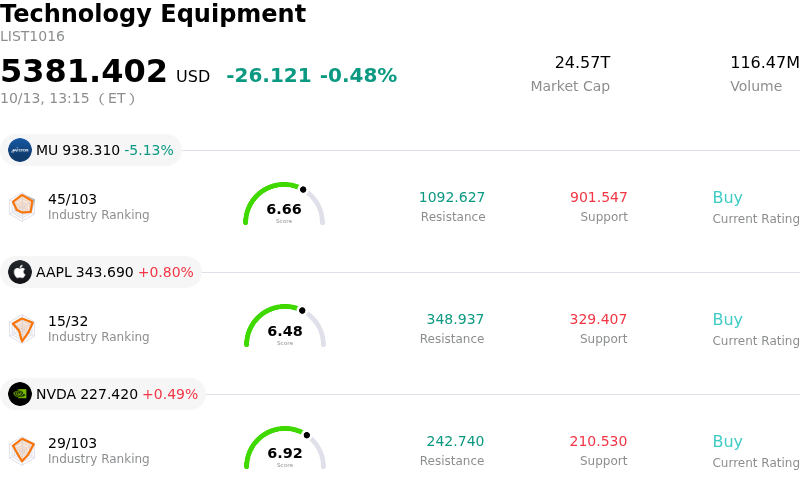
What is driving ASML Holding NV (ASML)’s stock price down today?
ASML experienced notable selling pressure as market participants adjusted positions ahead of the company's upcoming third-quarter earnings release. With consensus expectations sitting near the upper bound of management's guidance range following strong year-to-date share price appreciation, institutional investors opted to de-risk portfolios. The elevated performance bar left little room for error, prompting profit-taking ahead of key updates regarding order intake and forward-looking guidance.
Sector-wide headwinds further intensified the retreat. Broad weakness across the global semiconductor complex weighed heavily on equipment suppliers as renewed anxieties surfaced regarding artificial intelligence spending cycles and customer capital expenditure timing. News of technological progress by Chinese chipmakers in memory architectures created incremental caution around capital allocation by major memory producers, who represent a significant portion of lithography tool shipments. Because lithography demand is tightly coupled to fab expansion cycles, sentiment around client capex directly impacted the equipment leader.
Valuation dynamics also played a critical role in the market reaction. Trading at a premium relative to historical averages and broader tech benchmarks, the stock remains sensitive to shifts in market sentiment and macro uncertainty surrounding trade policies. Investors are primarily focused on whether management can demonstrate sustained demand visibility into coming years and successfully pass through planned pricing adjustments on maintenance services without dampening customer demand. Until quarterly results confirm robust order backlogs, heightened volatility is expected to persist across the semiconductor equipment segment.
Technical Analysis of ASML Holding NV (ASML)
Technically, ASML Holding NV (ASML) shows a MACD (12,26,9) value of -16.835, indicating a neutral signal. The RSI at 42.541 suggests neutral condition and the Williams %R at 92.922 suggests oversold condition. Please monitor closely.
Fundamental Analysis of ASML Holding NV (ASML)
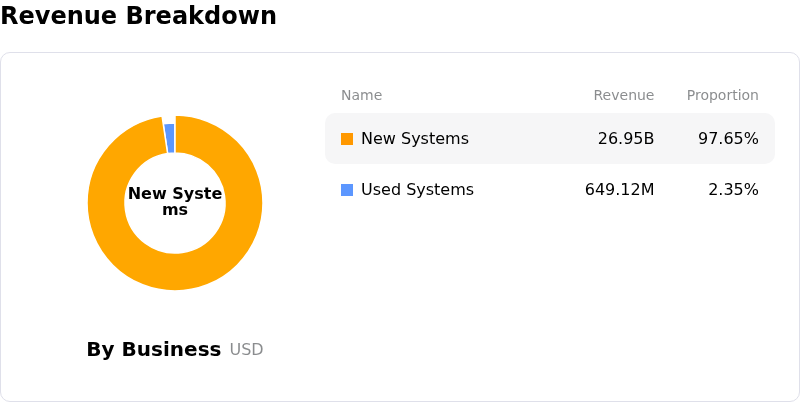
ASML Holding NV (ASML) is in the Technology Equipment industry. Its latest annual revenue is $36.83B, ranking 8 in the industry. The net profit is $10.83B, ranking 6 in the industry. Company Profile
Over the past month, multiple analysts have rated the company as Buy, with an average price target of $2204.64, a high of $2915.00, and a low of $1450.00.
More details about ASML Holding NV (ASML)
Company Specific Risks:
- Pre-Earnings Volatility and Valuation Multipliers: Markets are pricing in heightened implied volatility ahead of the Q3 earnings report, with ASML trading at a demanding valuation premium that leaves the stock vulnerable to pullbacks if forward booking visibility or gross margin commentary misses elevated expectations.
- Geopolitical Export Controls in China: Tightened U.S. and Dutch regulatory restrictions targeting the sale and servicing of deep ultraviolet (DUV) immersion tools continue to constrain revenue from Chinese semiconductor manufacturers, pushing China's contribution to system sales down toward 20%.
- Customer Capex Friction and AI Infrastructure Cost Pressures: Macro concerns regarding AI data center financing costs alongside client cost friction over upcoming EUV component price increases threaten to delay near-term lithography equipment capex from major memory and foundry customers.
- High-NA EUV Commercial Adoption Delays: Industry concerns that customer adoption of high-cost High-NA EUV lithography platforms could extend further toward 2030 pose risks to near-term revenue growth and tool deployment timelines for next-generation technology.
Recommended Articles


