


Vertex Pharmaceuticals Inc Stock (VRTX) Moved Down by 3.13% on Oct 13: What Investors Need To Know
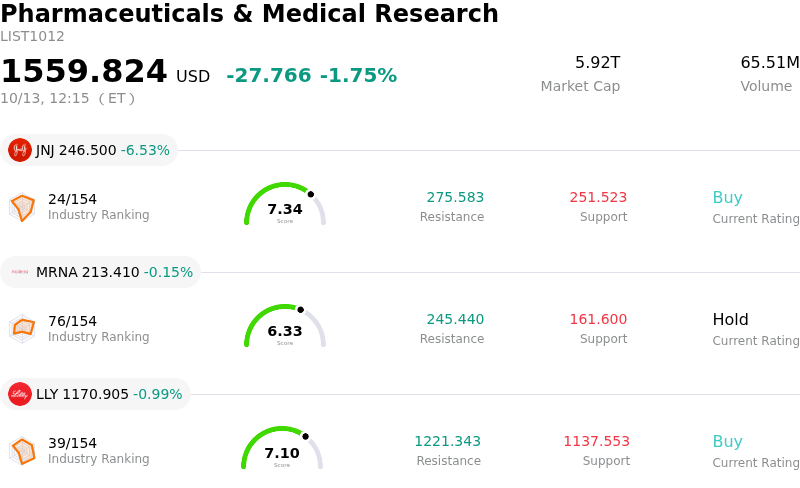
Vertex Pharmaceuticals Inc (VRTX) moved down by 3.13%. The Pharmaceuticals & Medical Research sector is down by 1.75%. The company underperformed the industry. Top 3 stocks by turnover in the sector: Johnson & Johnson (JNJ) down 6.51%; Moderna Inc (MRNA) down 0.15%; Eli Lilly and Co (LLY) down 0.99%.
What is driving Vertex Pharmaceuticals Inc (VRTX)’s stock price down today?
Vertex Pharmaceuticals experienced downward price pressure driven primarily by broader weakness across the biotechnology sector and short-term technical selling pressure. As investors position ahead of the company's upcoming third-quarter earnings release, slight downward revisions to quarterly consensus estimates and recent price target adjustments from sell-side analysts have tempered short-term sentiment. Institutional research recently highlighted expectations for a temporary sequential easing in mature cystic fibrosis product revenues as patient adoption shifts toward next-generation combination regimens, prompting brief profit-taking.
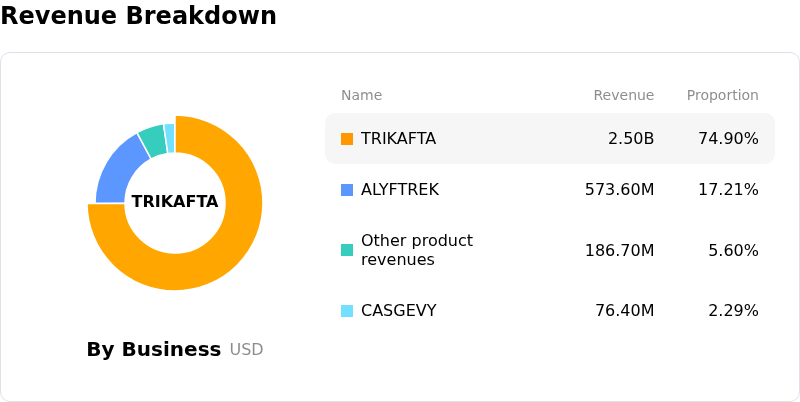
Despite the intraday pullback, Vertex's core fundamental foundation remains supported by its market leadership in cystic fibrosis and accelerating pipeline diversification. Key operational drivers include the ongoing launch and clinical advancement of Alyftrek, which recently delivered encouraging phase trial results demonstrating functional recovery in pediatric populations. Furthermore, commercial progress in non-cystic fibrosis assets—such as Casgevy for rare blood disorders and Journavx for non-opioid acute pain management—continues to broaden the long-term revenue base.
Looking forward, investor focus will remain anchored on third-quarter execution, commercial uptake of new therapies, and updates regarding clinical development in kidney disease and diabetes programs. While near-term technical consolidation and valuation premiums may contribute to ongoing intraday volatility, the company's robust balance sheet, high-margin cash flow generation, and deep pipeline present a durable growth profile for institutional portfolios.
Technical Analysis of Vertex Pharmaceuticals Inc (VRTX)
Technically, Vertex Pharmaceuticals Inc (VRTX) shows a MACD (12,26,9) value of -3.572, indicating a sell signal. The RSI at 34.278 suggests neutral condition and the Williams %R at 99.640 suggests oversold condition. Please monitor closely.
Fundamental Analysis of Vertex Pharmaceuticals Inc (VRTX)
Vertex Pharmaceuticals Inc (VRTX) is in the Pharmaceuticals & Medical Research industry. Its latest annual revenue is $12.00B, ranking 21 in the industry. The net profit is $3.95B, ranking 16 in the industry. Company Profile
Over the past month, multiple analysts have rated the company as Buy, with an average price target of $571.75, a high of $667.00, and a low of $350.00.
More details about Vertex Pharmaceuticals Inc (VRTX)
Company Specific Risks:
- Revenue Concentration and Pipeline Program Failures: The company remains heavily dependent on its core cystic fibrosis franchise, exposing investors to revenue volatility following pipeline setbacks such as the discontinuation of the VX-264 cell therapy program for type 1 diabetes and ongoing patent disputes around gene-editing therapies.
- Downward EPS Revisions and Commercialization Expenses: Analyst consensus Q3 earnings estimates have been revised downward by approximately 4.5% over the past month due to accelerating operational spending, with combined 2026 R&D and SG&A costs projected between $6.3 billion and $6.45 billion driven by launch costs for non-opioid pain drug Journavx.
- Acquisition Integration and Margin Compression: Recent multi-billion-dollar capital expenditures for major acquisitions, including Crinetics Pharmaceuticals and Alpine Immune Sciences, present short-term execution risks, integration friction, and downward pressure on operating margins.
- Valuation Multiple Exposure to Macro Headwinds: Trading at a forward price-to-earnings multiple of roughly 27–29x compared to the biopharmaceutical sector average of ~22x, the stock faces amplified intraday selling pressure when elevated Treasury yields drive institutional profit-taking in high-valuation growth names.
Recommended Articles


