


Caterpillar Inc Stock (CAT) Moved Down by 4.19% on Oct 13: A Full Analysis
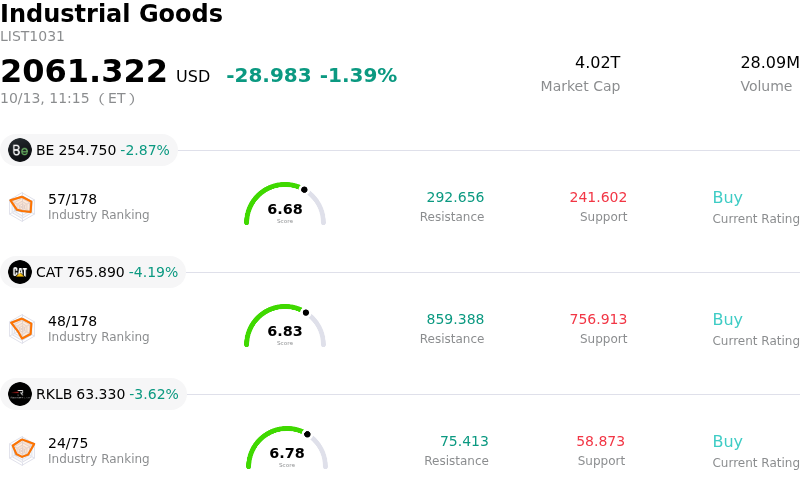
Caterpillar Inc (CAT) moved down by 4.19%. The Industrial Goods sector is down by 1.39%. The company underperformed the industry. Top 3 stocks by turnover in the sector: Bloom Energy Corp (BE) down 2.87%; Caterpillar Inc (CAT) down 4.19%; Rocket Lab USA Inc (RKLB) down 3.62%.
What is driving Caterpillar Inc (CAT)’s stock price down today?
Caterpillar experienced notable downside volatility during the trading session, reflecting a confluence of macroeconomic cost pressures, analyst target revisions, and regulatory uncertainty impacting the broader industrial sector. A primary macro catalyst driving the weakness is sustained upward pressure on long-term benchmark Treasury yields. High interest rates elevate financing costs for capital-intensive machinery buyers in construction, mining, and energy, creating investor anxiety over potential order deferrals or dealer inventory destocking despite solid existing backlogs.
Sentiment across the heavy machinery sector has also been constrained by increased regulatory scrutiny regarding equipment distribution and repair practices. Although Caterpillar maintains a primary focus on heavy construction and mining equipment rather than dedicated farm machinery, broad regulatory inquiries across industrial equipment markets have generated sector-wide caution. This regulatory friction, combined with recent high-profile insider share sales and key executive leadership transitions, has prompted tactical institutional profit-taking following the stock's significant appreciation earlier in the year.
Wall Street sentiment has similarly moderated, with quantitative and fundamental analyst downgrades citing stretched valuation multiples. Trading at a premium earnings multiple relative to historical industrial averages, the stock became particularly sensitive to price target adjustments ahead of the upcoming quarterly financial report. Investors are actively reassessing risk-reward profiles given expected second-half margin headwinds, including elevated tariff burdens and rising input costs across the construction equipment segment.
Despite these immediate headwinds, institutional investors note that Caterpillar retains structural support from long-term secular demand drivers, particularly power generation equipment supporting artificial intelligence data center infrastructure and energy transition projects. However, until interest rate volatility stabilizes and upcoming quarterly earnings clarify margin trajectories, intraday price action is likely to remain unsettled as market participants balance near-term macroeconomic friction against multi-year backlog visibility.
Technical Analysis of Caterpillar Inc (CAT)
Technically, Caterpillar Inc (CAT) shows a MACD (12,26,9) value of -8.764, indicating a sell signal. The RSI at 36.904 suggests neutral condition and the Williams %R at 99.364 suggests oversold condition. Please monitor closely.
Fundamental Analysis of Caterpillar Inc (CAT)
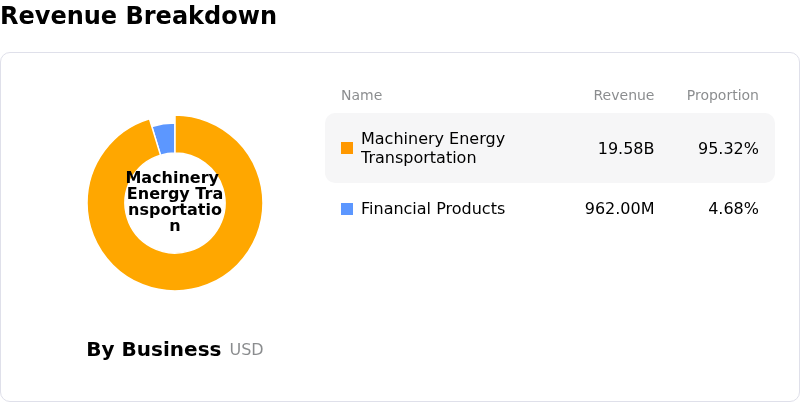
Caterpillar Inc (CAT) is in the Industrial Goods industry. Its latest annual revenue is $67.59B, ranking 1 in the industry. The net profit is $8.88B, ranking 1 in the industry. Company Profile
Over the past month, multiple analysts have rated the company as Buy, with an average price target of $947.48, a high of $1155.00, and a low of $575.00.
More details about Caterpillar Inc (CAT)
Company Specific Risks:
- Federal Regulatory Inquiry: A joint inquiry by the Federal Trade Commission (FTC) and the U.S. Department of Agriculture (USDA) targeting agricultural and heavy equipment sales, repair restrictions, and contract terms has introduced regulatory uncertainty across the machinery sector.
- Analyst Downgrades and Valuation Sensitivity: Recent Wall Street coverage cuts, including a quantitative downgrade to "Hold" by Zacks Research and price target reductions, have intensified selling pressure on the stock due to its elevated P/E ratio above 34x ahead of upcoming Q3 earnings.
- Surging Yields and Equipment Financing Headwinds: Spiking U.S. Treasury yields are inflating borrowing costs for commercial customers, threatening to constrain debt-financed capital spending across key construction, mining, and infrastructure end-markets.
- Tariff Pressures and Operating Margin Compression: Elevated input costs, supply chain friction, and persistent trade tariff impacts are weighing on profitability, pushing projected adjusted operating margins toward the lower end of management's target range.
Recommended Articles


