

Cotton Futures (COTTON-F) Surges on Sep 21: Key Factors to Watch

Source Tradingkey

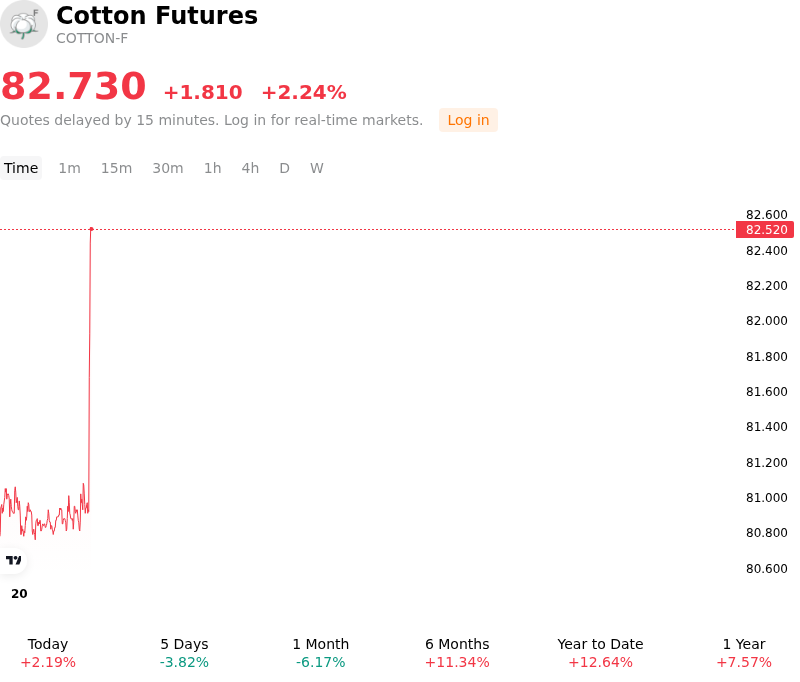
Cotton Futures (COTTON-F) is up 2.24% at Sep 21 21:05(ET), now at $82.73, with a 7-day down of 2.01%.
SummaryOverview

What is driving Cotton Futures (COTTON-F)’s stock price up today?

Cotton futures advanced as market participants re-evaluated tightening global supply expectations against persistent weather challenges in primary domestic growing regions. The primary catalyst driving the upward momentum was the continued impact of severe heat and moisture deficits across the Southwestern United States, particularly in West Texas. These harsh environmental conditions have led to elevated acreage abandonment rates and reduced yield prospects, reinforcing recent projections from agricultural authorities that U.S. production will remain significantly constrained during the current crop year.

Beyond domestic weather impacts, the broader supply-demand balance sheet presents a tightening outlook that continues to underpin physical market pricing. Global ending stock projections have drifted toward multi-year lows, driven by a structural imbalance where global mill consumption is expected to exceed total world production. Steady demand from spinning mills across key Asian textile centers, combined with reduced exportable surpluses from major producing nations, has tightened prompt availability and supported benchmark global price indexes.

Technical positioning and institutional capital flows also played a significant role in accelerating the advance. After testing lower support thresholds near multi-month lows, oversold technical indicators triggered institutional short-covering and systematic buying. A softer U.S. dollar and stabilizing risk sentiment across the broader agricultural complex further incentivized speculative traders to rebuild long positions. While investors remain attentive to harvest progress and weekly export sales velocity, the combination of reduced harvest expectations and tightening global inventories maintains a constructive underlying foundation for cotton prices.

Technical Analysis of Cotton Futures (COTTON-F)

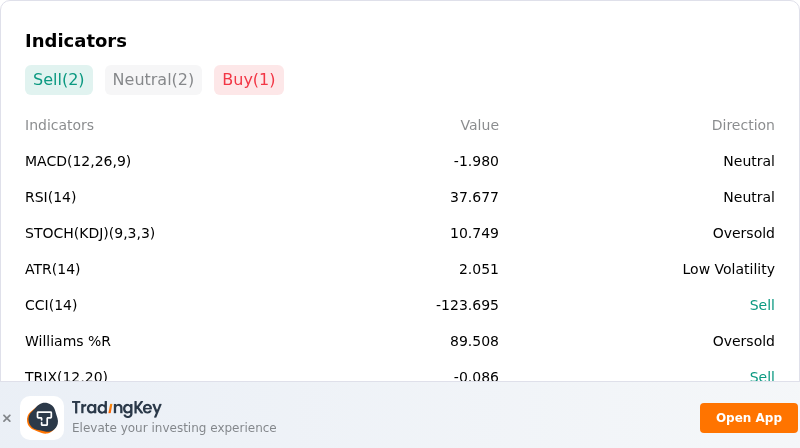
Technically, Cotton Futures (COTTON-F) shows a MACD (12,26,9) value of -1.980, indicating a neutral signal. The RSI at 37.677 suggests neutral condition and the Williams %R at 89.508 suggests oversold condition. Please monitor closely.
IndicatorAnalysis

More details about Cotton Futures (COTTON-F)

Recent Events and Risks:

  • Sluggish Export Demand and Subdued Sales: Recent USDA weekly trade updates revealed persistent weakness in U.S. export commitments, reflecting hesitant international mill purchasing and placing downside pressure on futures contracts despite reduced domestic yield forecasts.
  • Global Production Surplus Forecasts: Industry forecasts from the International Cotton Advisory Committee (ICAC) project global output to marginally exceed global consumption, highlighting oversupply risks that continue to cap speculative buying interest.
  • Substitution Pressure from Energy Markets and Currency Strength: Lower crude oil futures have cheapened competing synthetic polyester fibers, while firm U.S. dollar valuations have made dollar-denominated cotton futures less attractive to overseas textile buyers.
  • Domestic Supply Replenishment via Chinese Reserve Auctions: Daily releases from China's state cotton reserves have increased near-term spot supply within the domestic market, dampening immediate import appetite from the world's largest consumer.
Disclaimer: For information purposes only. Past performance is not indicative of future results.
placeholder
Bitcoin falls below $75,000 as the CLARITY Act fails in the Senate — what the vote means for cryptoThe US Senate blocked the Digital Asset Market CLARITY Act in a 49-50 procedural vote, sending Bitcoin briefly below $75,000 — its biggest one-day drop since June. Ethereum fell more than 8%, Coinbase slid 10% and $75 billion of crypto market value evaporated. Here is what the vote was, why it failed, and the levels that matter now.
Author  Suzie
Sep 16, Wed
The US Senate blocked the Digital Asset Market CLARITY Act in a 49-50 procedural vote, sending Bitcoin briefly below $75,000 — its biggest one-day drop since June. Ethereum fell more than 8%, Coinbase slid 10% and $75 billion of crypto market value evaporated. Here is what the vote was, why it failed, and the levels that matter now.
placeholder
Dollar index tops 100 for the first time since July as the Fed's hawkish dot plot sinks inThe U.S. dollar index broke back above 100 for the first time since 31 July after the Fed delivered its first rate hike since 2023, with the dot plot showing 16 of 18 officials expect at least one more increase this year. Here are the levels that matter for DXY, the currencies feeling it most, and what to watch next.
Author  Irene Q.
Sep 17, Thu
The U.S. dollar index broke back above 100 for the first time since 31 July after the Fed delivered its first rate hike since 2023, with the dot plot showing 16 of 18 officials expect at least one more increase this year. Here are the levels that matter for DXY, the currencies feeling it most, and what to watch next.
placeholder
Gold rebounds to near $4,350 on weaker US Dollar, falling oil pricesGold price (XAU/USD) rises to near $4,345 during the early Asian session on Friday. The precious metal rebounds from a six-week low amid falling oil prices and a weaker US Dollar (USD). Traders continue to assess the latest Federal Reserve (Fed) rate hike and policy cues.
Author  FXStreet
Sep 18, Fri
Gold price (XAU/USD) rises to near $4,345 during the early Asian session on Friday. The precious metal rebounds from a six-week low amid falling oil prices and a weaker US Dollar (USD). Traders continue to assess the latest Federal Reserve (Fed) rate hike and policy cues.
placeholder
Gold ends three-week slide at the $4,400 line — eight straight days of ETF inflows vs a 5% 10-year and a 100 dollarSpot gold closed Friday at $4,378.39, up 0.84% on the day and about 0.8% for the week — its first weekly gain in four weeks — with the intraday high of $4,399.67 leaving it 33 cents shy of the $4,400 line. Gold ETFs have now logged eight straight sessions of inflows, but with the 10-year back above 5% and the dollar index near 100, here is what decides whether this is a reversal or a bounce.
Author  Suzie
21 hours ago
Spot gold closed Friday at $4,378.39, up 0.84% on the day and about 0.8% for the week — its first weekly gain in four weeks — with the intraday high of $4,399.67 leaving it 33 cents shy of the $4,400 line. Gold ETFs have now logged eight straight sessions of inflows, but with the 10-year back above 5% and the dollar index near 100, here is what decides whether this is a reversal or a bounce.
placeholder
Bitcoin squeezes back above $80,000 — 110,000 traders liquidated as the hawkish Fed and CLARITY setback fail to hold it down; is $83,000 next?Bitcoin closed above $80,000 on Friday for the first time since September 7, and pushed to $81,299 over the weekend, triggering about $603 million of liquidations — $523 million of them shorts — across more than 110,000 traders. With the Fed's hike already priced and the SEC and CFTC advancing crypto rules after the CLARITY Act failed, here is what stands between BTC and the $83,000 gate.
Author  Suzie
21 hours ago
Bitcoin closed above $80,000 on Friday for the first time since September 7, and pushed to $81,299 over the weekend, triggering about $603 million of liquidations — $523 million of them shorts — across more than 110,000 traders. With the Fed's hike already priced and the SEC and CFTC advancing crypto rules after the CLARITY Act failed, here is what stands between BTC and the $83,000 gate.
goTop
quote