

XRP (XRPUSD) Is up 1.64% on Sep 21: Why It Happened

Source Tradingkey

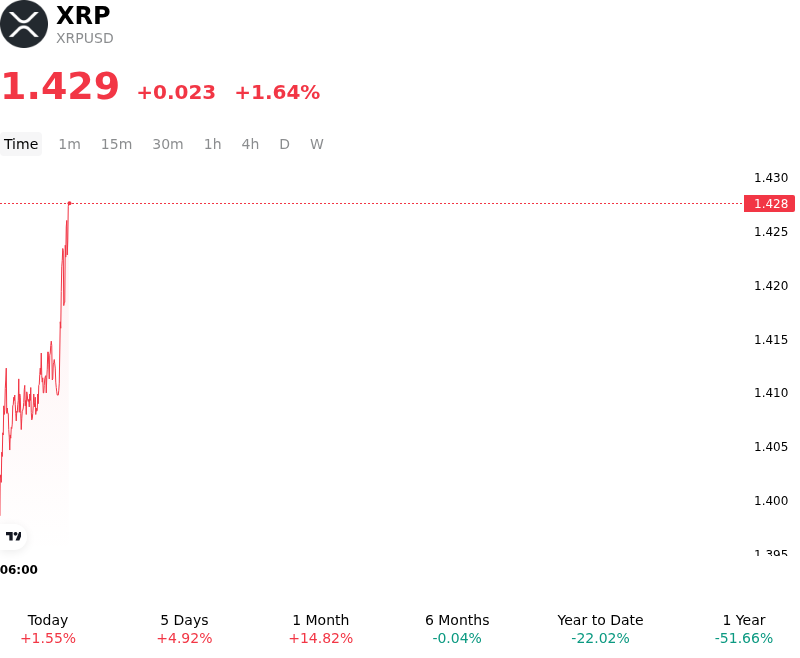
XRP (XRPUSD) is up 1.64% at Sep 21 20:20(ET), now at $1.429, with a 7-day down of 2.33%.
SummaryOverview

What is driving XRP (XRPUSD)’s stock price up today?

Capital flowed into XRP as renewed institutional interest and network upgrade developments strengthened investor sentiment across payment-focused digital assets. Anticipation surrounding protocol enhancements on the XRP Ledger, specifically batch transaction capabilities designed to improve throughput and operational efficiency for high-volume financial settlement, provided a tangible catalyst for market participants. Furthermore, steady demand through spot XRP investment vehicles continued to bolster base-level liquidity, offsetting broader portfolio rebalancing pressure and encouraging selective spot accumulation.

The constructive price action was further supported by an improving backdrop in digital asset regulatory perceptions. Established legal clarity distinguishing XRP as a non-security digital commodity has allowed institutional market participants to engage with reduced compliance tail risk compared to unclassified tokens. Although recent broader legislative delays initially weighed on risk sentiment across crypto assets, institutional integration—including the ongoing expansion of crypto-backed collateral frameworks and institutional payment pipelines—helped re-establish a firmer price floor. Derivatives markets reflected this stabilization as leveraged positioning recalibrated and funding rates normalized.

Looking ahead, XRP's medium-term trajectory remains tied to the execution of enterprise liquidity solutions, sustained net inflows into regulated investment products, and broader global macroeconomic liquidity conditions. While easing short-term volatility provides a favorable environment for accumulation, investors continue to monitor risks stemming from central bank rate trajectories, dollar strength, and remaining legislative uncertainties surrounding broader digital market structures.

Technical Analysis of XRP (XRPUSD)

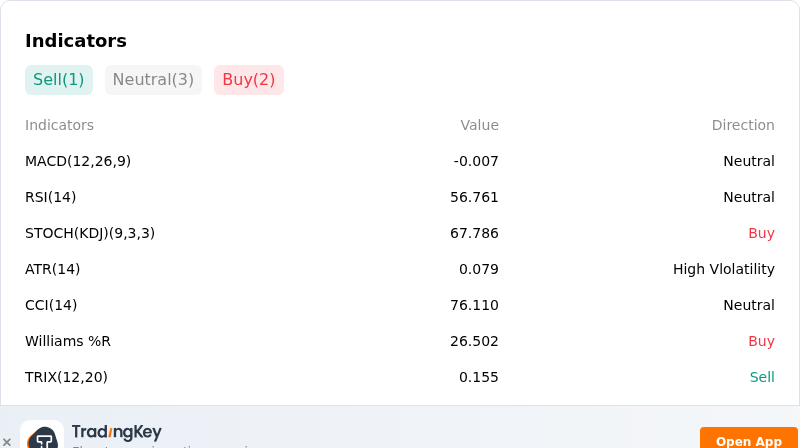
Technically, XRP (XRPUSD) shows a MACD (12,26,9) value of -0.007, indicating a neutral signal. The RSI at 56.761 suggests neutral condition and the Williams %R at 26.502 suggests buy condition. Please monitor closely.
IndicatorAnalysis

More details about XRP (XRPUSD)

Recent Events and Risks:

  • Legislative and Regulatory Stalls: Disappointment following the U.S. Senate's failure to advance the CLARITY Act has removed a primary regulatory relief catalyst for XRP, weakening market sentiment as expectations for codified crypto oversight collapse.
  • Institutional Spot ETF Outflows: U.S. spot XRP exchange-traded products recorded net daily outflows, interrupting a multi-week period of steady accumulation and signaling that institutional buying demand is turning cautious.
  • Technical Breakdown and Support Fragility: XRP slipped below key technical levels including the $1.33 support zone and its 50-day exponential moving average (EMA), reinforcing a bearish chart structure that increases vulnerability toward lower targets near $1.10 and $1.00.
  • Leverage Liquidation Cascades: Elevated macro headwinds—including persistent strength in the U.S. dollar and high Treasury yields—have driven broader risk-off selling, triggering forced unwinds of leveraged long positions across high-beta altcoins.
Disclaimer: For information purposes only. Past performance is not indicative of future results.
placeholder
Bitcoin falls below $75,000 as the CLARITY Act fails in the Senate — what the vote means for cryptoThe US Senate blocked the Digital Asset Market CLARITY Act in a 49-50 procedural vote, sending Bitcoin briefly below $75,000 — its biggest one-day drop since June. Ethereum fell more than 8%, Coinbase slid 10% and $75 billion of crypto market value evaporated. Here is what the vote was, why it failed, and the levels that matter now.
Author  Suzie
Sep 16, Wed
The US Senate blocked the Digital Asset Market CLARITY Act in a 49-50 procedural vote, sending Bitcoin briefly below $75,000 — its biggest one-day drop since June. Ethereum fell more than 8%, Coinbase slid 10% and $75 billion of crypto market value evaporated. Here is what the vote was, why it failed, and the levels that matter now.
placeholder
Dollar index tops 100 for the first time since July as the Fed's hawkish dot plot sinks inThe U.S. dollar index broke back above 100 for the first time since 31 July after the Fed delivered its first rate hike since 2023, with the dot plot showing 16 of 18 officials expect at least one more increase this year. Here are the levels that matter for DXY, the currencies feeling it most, and what to watch next.
Author  Irene Q.
Sep 17, Thu
The U.S. dollar index broke back above 100 for the first time since 31 July after the Fed delivered its first rate hike since 2023, with the dot plot showing 16 of 18 officials expect at least one more increase this year. Here are the levels that matter for DXY, the currencies feeling it most, and what to watch next.
placeholder
Gold rebounds to near $4,350 on weaker US Dollar, falling oil pricesGold price (XAU/USD) rises to near $4,345 during the early Asian session on Friday. The precious metal rebounds from a six-week low amid falling oil prices and a weaker US Dollar (USD). Traders continue to assess the latest Federal Reserve (Fed) rate hike and policy cues.
Author  FXStreet
Sep 18, Fri
Gold price (XAU/USD) rises to near $4,345 during the early Asian session on Friday. The precious metal rebounds from a six-week low amid falling oil prices and a weaker US Dollar (USD). Traders continue to assess the latest Federal Reserve (Fed) rate hike and policy cues.
placeholder
Gold ends three-week slide at the $4,400 line — eight straight days of ETF inflows vs a 5% 10-year and a 100 dollarSpot gold closed Friday at $4,378.39, up 0.84% on the day and about 0.8% for the week — its first weekly gain in four weeks — with the intraday high of $4,399.67 leaving it 33 cents shy of the $4,400 line. Gold ETFs have now logged eight straight sessions of inflows, but with the 10-year back above 5% and the dollar index near 100, here is what decides whether this is a reversal or a bounce.
Author  Suzie
21 hours ago
Spot gold closed Friday at $4,378.39, up 0.84% on the day and about 0.8% for the week — its first weekly gain in four weeks — with the intraday high of $4,399.67 leaving it 33 cents shy of the $4,400 line. Gold ETFs have now logged eight straight sessions of inflows, but with the 10-year back above 5% and the dollar index near 100, here is what decides whether this is a reversal or a bounce.
placeholder
Bitcoin squeezes back above $80,000 — 110,000 traders liquidated as the hawkish Fed and CLARITY setback fail to hold it down; is $83,000 next?Bitcoin closed above $80,000 on Friday for the first time since September 7, and pushed to $81,299 over the weekend, triggering about $603 million of liquidations — $523 million of them shorts — across more than 110,000 traders. With the Fed's hike already priced and the SEC and CFTC advancing crypto rules after the CLARITY Act failed, here is what stands between BTC and the $83,000 gate.
Author  Suzie
21 hours ago
Bitcoin closed above $80,000 on Friday for the first time since September 7, and pushed to $81,299 over the weekend, triggering about $603 million of liquidations — $523 million of them shorts — across more than 110,000 traders. With the Fed's hike already priced and the SEC and CFTC advancing crypto rules after the CLARITY Act failed, here is what stands between BTC and the $83,000 gate.
goTop
quote