


Ethereum (ETHUSD) Is up 1.70% on Sep 21: What Do On-Chain Data and Market Sentiment Show?
Ethereum (ETHUSD) is up 1.70% at Sep 21 20:15(ET), now at $2676.81, with a 7-day up of 4.23%.
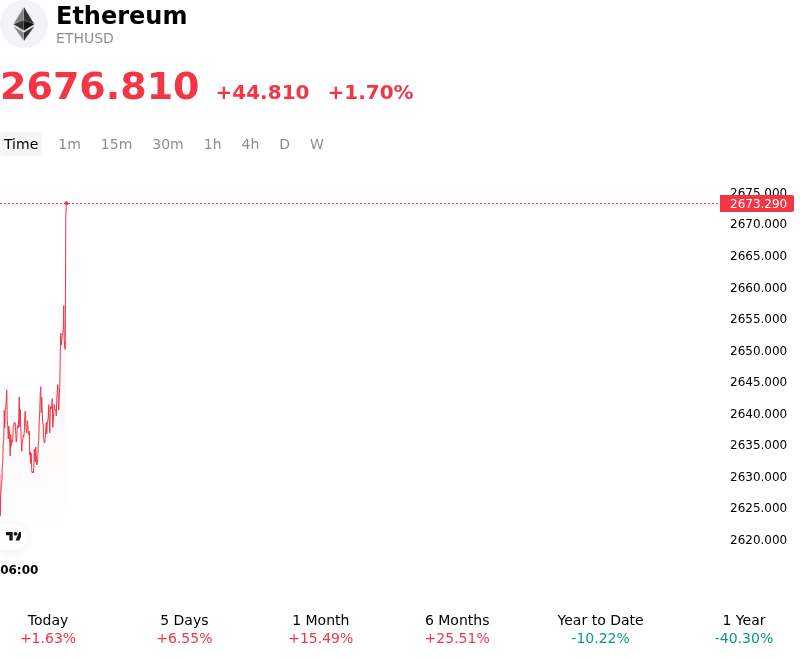
What is driving Ethereum (ETHUSD)’s stock price up today?
Capital flowed back into Ethereum during the trading session, driven by a combination of recovering spot ETF demand, stabilizing macroeconomic sentiment following recent central bank rate decisions, and a technical breakout above key resistance zones. After enduring mid-week institutional redemptions, U.S. spot Ethereum exchange-traded funds saw net inflows resume, led by renewed institutional allocations into major products. This shift in ETF flows restored market confidence, signaling that institutional investors view lower price levels as attractive long-term entry points rather than the beginning of a sustained distribution phase.
Underpinning this price strength is a compounding structural supply squeeze across the Ethereum ecosystem. On-chain data indicates that exchange-held Ether balances have descended toward multi-year lows, while the percentage of circulating supply locked in staking protocols has expanded past thirty-five percent. This dual mechanism of exchange outflows and persistent staking growth has significantly reduced liquid market depth on spot exchanges. As institutional and retail spot demand returned during the session, the diminished liquid float amplified buy-side order flow, allowing prices to absorb overhead supply and push cleanly above prior consolidation levels.
Derivatives market positioning further reflected a healthy, spot-driven expansion in risk appetite rather than a leveraged short squeeze. Funding rates across major perpetual swap contracts remained modestly positive, indicating balanced leverage and constructive positioning among market participants. Furthermore, robust Layer-2 network transaction volumes and ongoing expansion in decentralized finance and asset tokenization continue to solidify Ethereum's fundamental store-of-value and utility narrative. While macro liquidity conditions and interest rate expectations remain a key focus for institutional allocators, the combination of tightening exchange supply, rising staking participation, and resilient spot ETF demand provides a solid foundation for continued price stability and upward momentum.
Technical Analysis of Ethereum (ETHUSD)
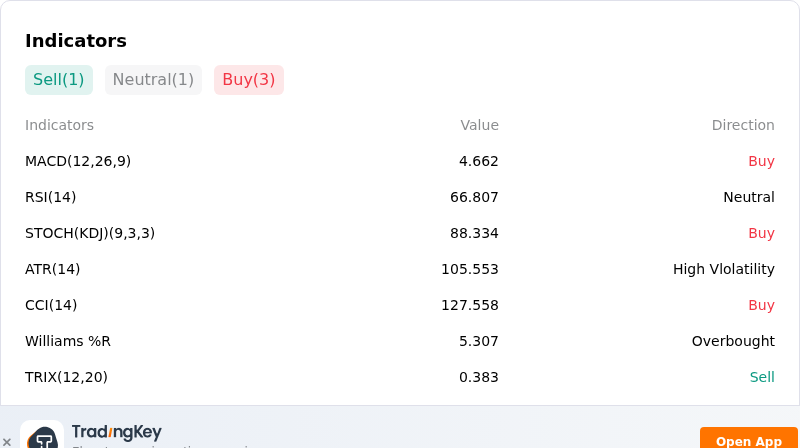
Technically, Ethereum (ETHUSD) shows a MACD (12,26,9) value of 4.662, indicating a buy signal. The RSI at 66.807 suggests neutral condition and the Williams %R at 5.307 suggests overbought condition. Please monitor closely.
More details about Ethereum (ETHUSD)
Recent Events and Risks:
- Technical Resistance Rejection and Liquidation Exposure: Ethereum encountered significant selling pressure upon reaching the $2.63K–$2.70K resistance cluster, driving price action down toward $2.58K. With futures open interest standing at an elevated $34.3 billion, losing the $2.50K support boundary risks triggering cascading long liquidations toward the $2.35K demand zone.
- Institutional Capital Outflows from Spot ETFs: U.S. spot Ethereum exchange-traded funds recorded over $142 million in daily net outflows as institutional investors reduced ETH exposure, draining spot market liquidity and creating persistent overhead sell pressure.
- Regulatory Setbacks and Legislative Delays: Broader market sentiment deteriorated following the failure of the CLARITY Act to advance in the U.S. Senate, which triggered swift spot selling across ETH and crypto-derivatives due to renewed legal and compliance uncertainty.
- Macroeconomic Volatility and Bond Yield Spikes: Spiking U.S. Treasury yields and hawkish monetary policy expectations have intensified risk-off sentiment across broad capital markets, suppressing capital allocations into risk assets like Ethereum and increasing intraday downside sensitivity.
Recommended Articles


