

XRP (XRPUSD) Suddenly Goes up 1.84% on Sep 20: What's Driving This

Source Tradingkey

XRP (XRPUSD) is up 1.84% at Sep 20 20:35(ET), now at $1.4286, with a 7-day up of 4.97%.
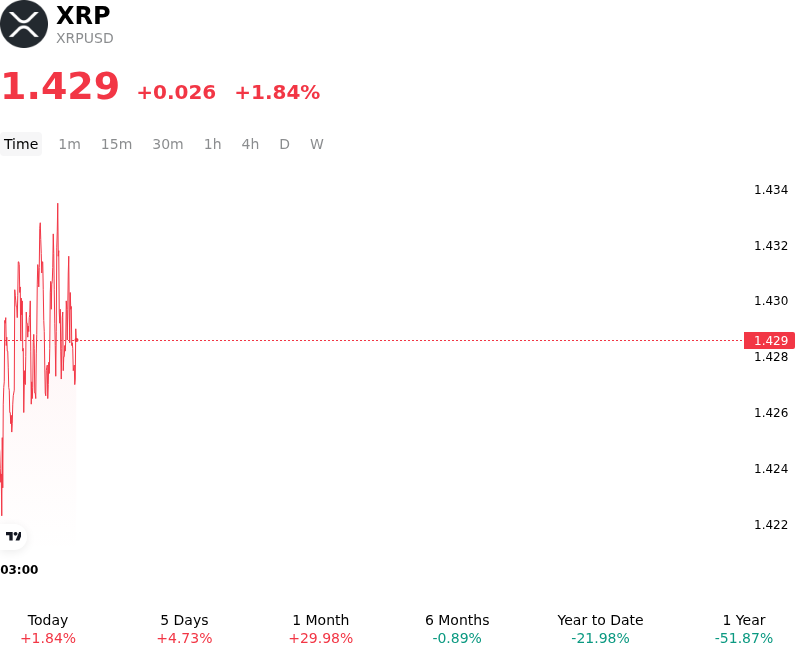
SummaryOverview

What is driving XRP (XRPUSD)’s stock price up today?

XRP experienced upward momentum as strong on-chain accumulation and structural network developments boosted investor sentiment and order book liquidity. Institutional market participants and large-scale holders significantly expanded their positions, absorbing sell-side pressure and creating a supportive environment for price appreciation. This spot-driven buying was complemented by a noticeable spike in active network transactions on the XRP Ledger, signaling elevated asset velocity and expanding ecosystem utility. As short-term spot demand surged, derivatives market mechanics further amplified gains through forced short-position liquidations, driving capital back into the asset.

Ecosystem-specific catalysts played a decisive role in shifting market expectations. Investors actively repriced the token ahead of the upcoming activation of the Batch V1.1 protocol upgrade on the XRP Ledger. By enabling atomic execution for multi-transaction bundles, the upgrade enhances settlement efficiency and lowers operational complexity for enterprise payment workflows and asset managers. Furthermore, the asset benefited from its relative regulatory clarity compared to the broader digital asset market, enabling institutional capital to reallocate into XRP amidst shifting policy headlines.

The broader macroeconomic environment and improving digital-asset risk sentiment provided additional tailwinds. As capital flows turned constructive across major liquid altcoins, XRP exhibited improving liquidity depth and sustained buying interest. Looking ahead, institutional market participants remain focused on potential risks, including macro liquidity tightening, leverage-driven volatility in perpetual futures, and execution risks tied to network upgrades. However, the current advance underscores a market driven by expanding protocol utility, institutional positioning, and robust on-chain demand.

Technical Analysis of XRP (XRPUSD)

Technically, XRP (XRPUSD) shows a MACD (12,26,9) value of -0.018, indicating a neutral signal. The RSI at 57.337 suggests neutral condition and the Williams %R at 25.761 suggests buy condition. Please monitor closely.
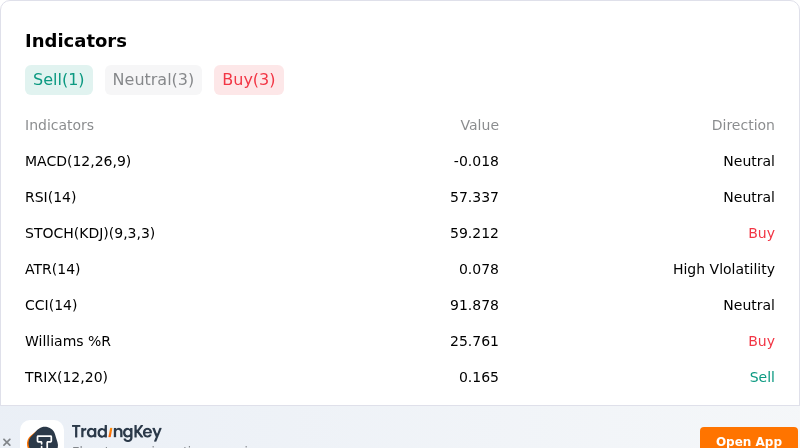
IndicatorAnalysis

More details about XRP (XRPUSD)

Recent Events and Risks:

  • U.S. CLARITY Act Failure in Senate: XRP experienced sharp downside pressure following a failed procedural vote in the U.S. Senate to advance the Digital Asset Market Clarity Act, delaying statutory market-structure legislation and unwinding speculative bets on explicit federal commodity classification.
  • Leveraged Long Liquidations and Negative Funding: The sudden price rejection triggered over $40 million in long position liquidations across major exchanges, flushing out leveraged traders and dragging perpetual funding rates negative, leaving intraday price action vulnerable to further stop-loss cascades.
  • Whale Deposit Spikes to Centralized Exchanges: On-chain data highlighted a surge in 30-day whale transfers to Binance, topping 1.6 billion XRP, raising market fears of increased sell-side overhead supply during a period of diminished order book liquidity.
  • Macro Rate Hike Headwinds: Resurgent macro pressure following the Federal Reserve's 25-basis-point interest rate increase and elevated U.S. Treasury yields triggered risk-off sentiment, encouraging capital rotation out of high-beta digital assets.
Disclaimer: For information purposes only. Past performance is not indicative of future results.
placeholder
Fed hike odds near 90% into Wednesday's decision — how to trade the dollar, gold and the S&P 500A 0.3% monthly core CPI print has lifted the market-implied probability of a 25bp Fed hike on 16 September to roughly 86.5% ~ 90%, which would be the first increase since July 2023. Here is the decision timeline, the pricing versus the forecasts, both scenarios, and the key levels for the dollar, gold and the S&P 500.
Author  Suzie
Sep 14, Mon
A 0.3% monthly core CPI print has lifted the market-implied probability of a 25bp Fed hike on 16 September to roughly 86.5% ~ 90%, which would be the first increase since July 2023. Here is the decision timeline, the pricing versus the forecasts, both scenarios, and the key levels for the dollar, gold and the S&P 500.
placeholder
Dow drops 631 points as the Fed hikes — but futures are rebounding: what's next for US stocks?The Dow fell 631 points and the S&P 500 closed below 7,600 after the Fed hiked rates for the first time since 2023, with the dot plot showing 16 of 18 officials expect more tightening. Asia-session futures are already recovering — here are the levels and analyst views that decide whether 7,500 holds.
Author  Irene Q.
Sep 17, Thu
The Dow fell 631 points and the S&P 500 closed below 7,600 after the Fed hiked rates for the first time since 2023, with the dot plot showing 16 of 18 officials expect more tightening. Asia-session futures are already recovering — here are the levels and analyst views that decide whether 7,500 holds.
placeholder
Dollar index tops 100 for the first time since July as the Fed's hawkish dot plot sinks inThe U.S. dollar index broke back above 100 for the first time since 31 July after the Fed delivered its first rate hike since 2023, with the dot plot showing 16 of 18 officials expect at least one more increase this year. Here are the levels that matter for DXY, the currencies feeling it most, and what to watch next.
Author  Irene Q.
Sep 17, Thu
The U.S. dollar index broke back above 100 for the first time since 31 July after the Fed delivered its first rate hike since 2023, with the dot plot showing 16 of 18 officials expect at least one more increase this year. Here are the levels that matter for DXY, the currencies feeling it most, and what to watch next.
placeholder
Gold rebounds to near $4,350 on weaker US Dollar, falling oil pricesGold price (XAU/USD) rises to near $4,345 during the early Asian session on Friday. The precious metal rebounds from a six-week low amid falling oil prices and a weaker US Dollar (USD). Traders continue to assess the latest Federal Reserve (Fed) rate hike and policy cues.
Author  FXStreet
Sep 18, Fri
Gold price (XAU/USD) rises to near $4,345 during the early Asian session on Friday. The precious metal rebounds from a six-week low amid falling oil prices and a weaker US Dollar (USD). Traders continue to assess the latest Federal Reserve (Fed) rate hike and policy cues.
placeholder
US to delay new "overcapacity" tariffs on China — what the pause means for trade, inflation and the dollarWashington is expected to hold off announcing new tariffs over Chinese "overcapacity" until after the 24 September summit, according to Bloomberg. The postponed plan would have added 7.5% to Chinese goods, taking second-term US tariffs to around 20%. Here is what is on the table, and what a deal versus no deal would mean for the yuan, Hong Kong equities and the dollar.
Author  Mitrade
Sep 18, Fri
Washington is expected to hold off announcing new tariffs over Chinese "overcapacity" until after the 24 September summit, according to Bloomberg. The postponed plan would have added 7.5% to Chinese goods, taking second-term US tariffs to around 20%. Here is what is on the table, and what a deal versus no deal would mean for the yuan, Hong Kong equities and the dollar.
goTop
quote