


Ethereum (ETHUSD) Is down 1.22% on Sep 13: What Do On-Chain Data and Market Sentiment Show?
Ethereum (ETHUSD) is down 1.22% at Sep 13 04:40(ET), now at $2487.51, with a 7-day down of 0.38%.
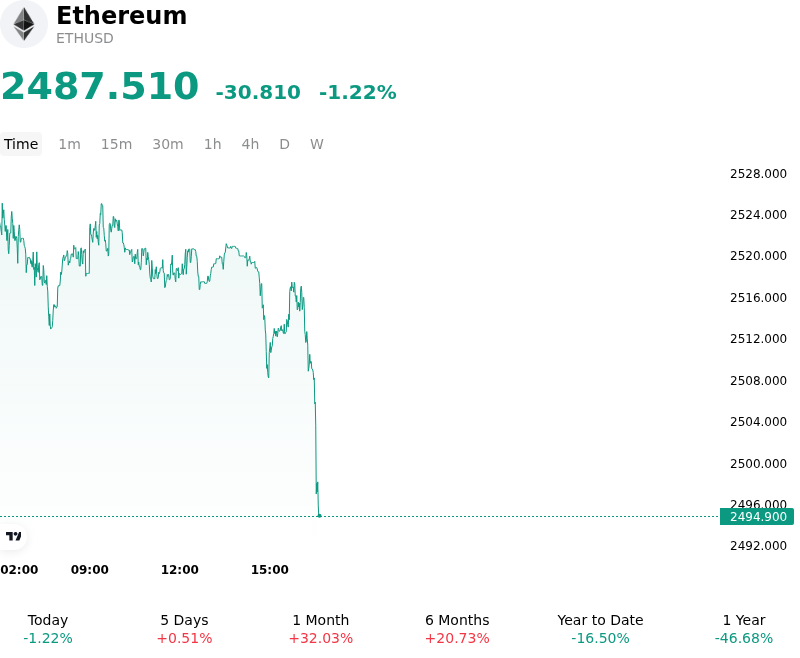
What is driving Ethereum (ETHUSD)’s stock price down today?
The pull-back in Ethereum reflects broader macroeconomic caution and localized leverage unwinding following a period of range-bound consolidation. Investors recalibrated risk exposure as shifting expectations regarding Federal Reserve monetary policy and sticky inflation metrics pushed Treasury yields higher, dampening broader market risk appetite. In an environment dominated by high interest rate expectations and macro uncertainty, high-beta digital assets experienced immediate pressure as capital temporarily moved toward defensive positioning ahead of upcoming central bank decisions and inflation data releases.
From a liquidity and derivatives perspective, Ethereum faced technical supply pressure near critical resistance levels, prompting short-term profit-taking among derivative market participants. Thin weekend order book depth amplified intraday price fluctuations, triggering minor long liquidations across major offshore exchanges. As leverage was flushed from perpetual swap markets, spot buying was insufficient to absorb localized selling pressure, resulting in a structural de-risking move across the altcoin space.
Despite the temporary downward pressure, broader institutional fundamentals remain supported by spot Ethereum ETF flow dynamics and ongoing network adoption. Market participants continue to closely monitor key legislative developments in Washington, including upcoming Congressional votes on digital asset regulatory frameworks, which could serve as pivotal catalysts for institutional capital deployment. Consequently, the intraday dip is largely interpreted by institutional investors as a routine liquidity reset rather than a shift in long-term structural demand for the network.
Technical Analysis of Ethereum (ETHUSD)
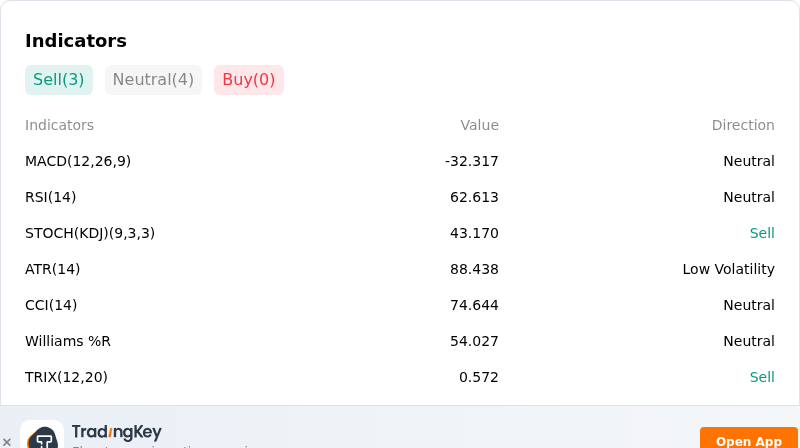
Technically, Ethereum (ETHUSD) shows a MACD (12,26,9) value of -32.317, indicating a neutral signal. The RSI at 62.613 suggests neutral condition and the Williams %R at 54.027 suggests neutral condition. Please monitor closely.
More details about Ethereum (ETHUSD)
Recent Events and Risks:
- Derivatives Over-Leverage and Mass Liquidation Exposure: On-chain derivatives data reveals heavy leveraged long positioning concentrated near key price thresholds, where a drop below the critical $2,405 support level risks triggering over $1.21 billion in cumulative long liquidations across major centralized exchanges, exposing the market to severe downside cascading risk.
- Macro Tightening Concerns Following Hotter U.S. Inflation Data: Hotter-than-expected U.S. August Producer Price Index (PPI) and Consumer Price Index (CPI) inflation prints have sharply increased market expectations for Federal Reserve rate hikes at the mid-September FOMC meeting, driving a broader risk-off posture across digital asset markets and pressuring ETH price action.
- Cooling Institutional Demand and Volatile ETF Outflows: Institutional inflows into U.S. spot Ethereum ETFs have shown significant deceleration compared to August's record pace, with elevated flow volatility and recurring multi-million-dollar daily redemptions dampening market depth and leaving prices vulnerable to overhead supply.
- Concentrated Whale Distribution and Technical Resistance Rejections: On-chain tracking highlighted substantial large-holder supply distribution—including a $408 million whale exit over recent sessions—combined with repeated technical rejections at the 50-week moving average resistance zone near $2,542–$2,550, heightening concern of a deeper pullback toward lower support levels.
Recommended Articles


