


Solana (SOLUSD) Is down 1.08% on Sep 11: What Are the Risk Factors?
Solana (SOLUSD) is down 1.08% at Sep 11 20:05(ET), now at $97.98, with a 7-day down of 2.76%.
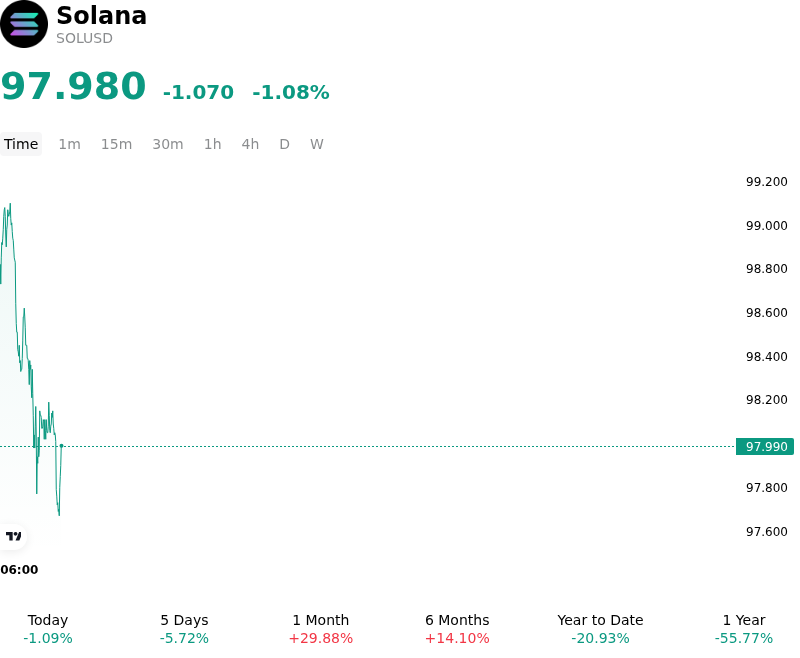
What is driving Solana (SOLUSD)’s stock price down today?
Solana experienced a minor intraday retreat as institutional demand paused following a period of strong capital accumulation. A primary catalyst behind the softening price action was a sharp deceleration in spot Solana ETF net inflows, which moderated significantly following an aggressive late-August expansion. The temporary decline in net fund creations removed immediate buy-side absorption, prompting institutional desks to adopt a more cautious stance. With primary ETF liquidity flows tapering, spot market depth thinned, leaving the asset vulnerable to short-term supply pressure near established overhead price ceilings.
The pullback was further amplified by technical resistance rejections and tactical deleveraging within the derivatives market. After advancing strongly over recent weeks, Solana encountered persistent selling pressure near overhead resistance bands, triggering a reduction in open interest and a trimming of leveraged long positions. The market also digested a sell-the-news reaction following the mainnet activation of the Transaction V1 upgrade. Although the core technical enhancement structurally expands network processing capabilities by increasing maximum transaction payload capacity, market participants utilized the successful execution as a liquidity window to realize short-term profits.
From a broader macro perspective, the modest weakness aligns with selective risk reduction across high-beta digital assets as institutional investors re-evaluate global liquidity conditions ahead of upcoming central bank policy decisions. Despite the intraday consolidation, underlying ecosystem fundamentals remain structurally intact, supported by steady developer engagement, low exchange token reserves, and upcoming protocol efficiency upgrades. Moving forward, market participants are monitoring spot ETF flow momentum, derivatives funding rates, and broader macro liquidity signals to assess whether the current retreat reflects temporary profit-taking or a deeper repricing across altcoin assets.
Technical Analysis of Solana (SOLUSD)
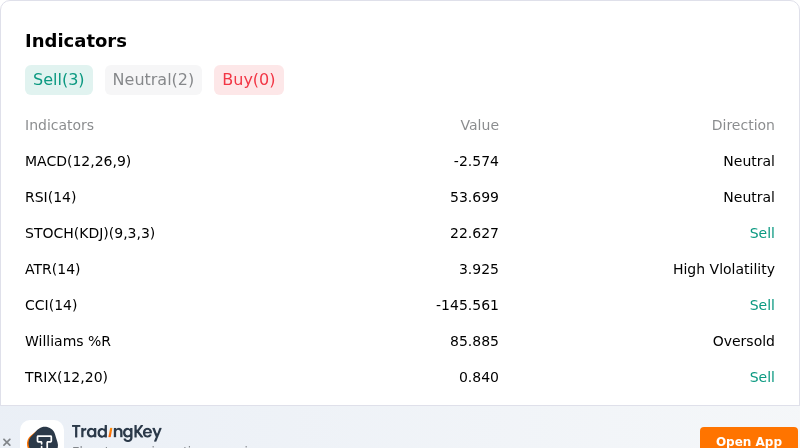
Technically, Solana (SOLUSD) shows a MACD (12,26,9) value of -2.574, indicating a neutral signal. The RSI at 53.699 suggests neutral condition and the Williams %R at 85.885 suggests oversold condition. Please monitor closely.
More details about Solana (SOLUSD)
Recent Events and Risks:
- Macro Risk-Off and Inflation Pressures: Broad digital asset market weakness driven by rising U.S. Treasury yields and elevated energy prices has intensified sell-side pressure on SOLUSD, dragging the token down over 3.5% toward the crucial $100 psychological support threshold.
- Derivatives Long Crowding and Liquidation Exposure: Futures positioning shows heavily asymmetric long crowding, which triggered over $11.7 million in forced liquidations—with long positions comprising over 84% of total liquidations—while negative funding rates exacerbate the risk of a leverage unwinding cascade if support fails.
- Institutional Flow Deceleration and ETF Outflows: Institutional demand via structured investment products has softened, evidenced by recent net outflows in Solana ETF products that break a multi-week inflow streak and reduce immediate spot market liquidity.
- Technical Resistance Rejection and Momentum Breakdown: SOL failed to overcome the overhead resistance band at $106–$107, causing short-term indicators such as the daily MACD and Commodity Channel Index to slip below zero and exposing downside targets around $98 and $90 if the $100 baseline breaks.
Recommended Articles


