


Solana (SOLUSD) Is up 2.66% on Sep 6: What Are the Risk Factors?
Solana (SOLUSD) is up 2.66% at Sep 6 00:00(ET), now at $104.95, with a 7-day up of 1.14%.
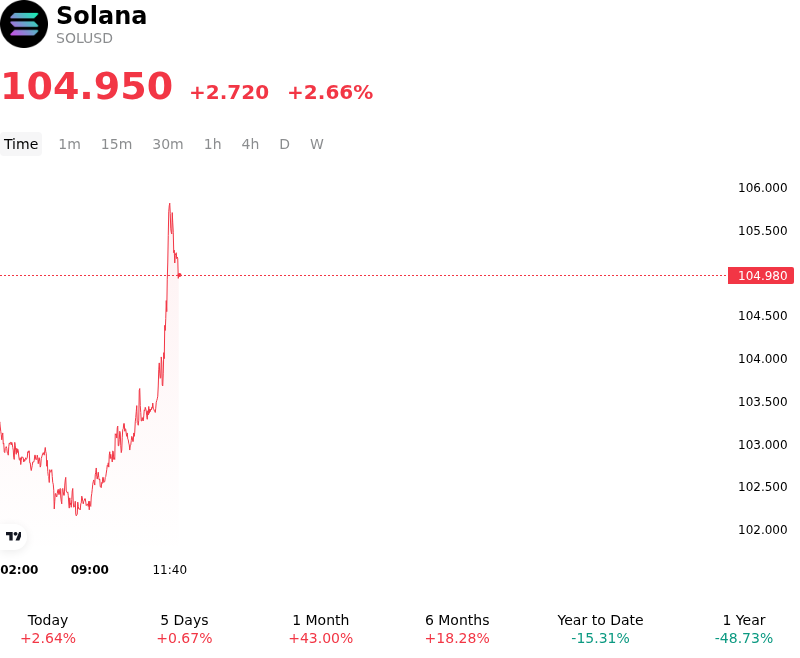
What is driving Solana (SOLUSD)’s stock price up today?
Solana advanced as persistent institutional spot demand and robust ETF inflow metrics continued to absorb secondary market supply. Following a historic accumulation period where spot Solana exchange-traded funds recorded their strongest weekly net inflows since inception, capital allocation into alternative digital asset products remains notably constructive. Institutional appetite, particularly through staking-integrated fund vehicles, has provided consistent underlying bids, driving total category assets under management to record highs. This sustained institutional accumulation reduced exchange-based circulating supply and created favorable order book depth, allowing spot buyers to absorb sell-side liquidity and push prices above key technical resistance levels.
Fundamental on-chain developments further reinforced market confidence and risk appetite. Solana maintained its leadership in decentralized finance and institutional real-world asset tokenization, leading major layer-1 networks in net monthly real-world asset inflows. Expanding user activity, marked by elevated daily address generation and surging decentralized exchange fee capture, highlighted genuine network usage beyond speculative positioning. Furthermore, market sentiment gained momentum ahead of scheduled core infrastructure upgrades, including fee optimization protocols and transaction framework enhancements designed to increase throughput and reduce transaction latency. These protocol developments strengthened long-term scalability expectations, encouraging medium-term position building among strategic digital asset funds.
From a market structure perspective, the upward momentum was accelerated by derivatives positioning and spot-driven liquidity repricing. As the token defended key psychological support levels, a modest expansion in open interest coupled with short-covering forced momentum traders to unwind hedge exposure above short-term moving averages. The combination of declining exchange balances and steady derivative funding rates underscores a healthy, spot-led advance rather than overleveraged speculative excess. However, institutional market participants continue to monitor broader global liquidity conditions, Federal Reserve monetary policy expectations, and macroeconomic risk sentiment, as sudden shifts in broader market conditions or a deceleration in ETF creation units could reintroduce near-term consolidation risks.
Technical Analysis of Solana (SOLUSD)
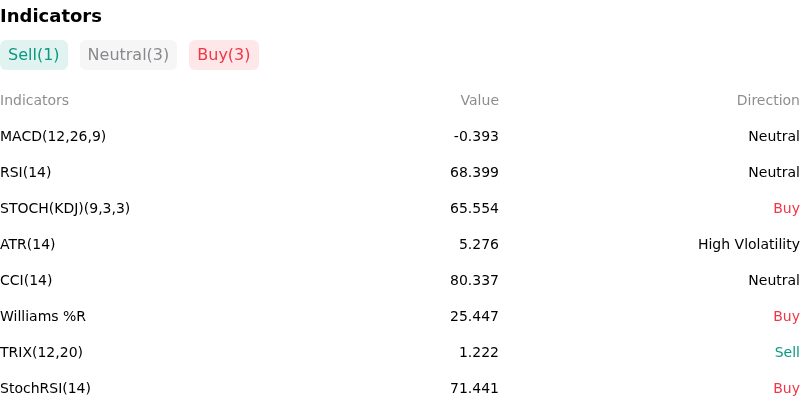
Technically, Solana (SOLUSD) shows a MACD (12,26,9) value of -0.397, indicating a neutral signal. The RSI at 68.370 suggests neutral condition and the Williams %R at 25.620 suggests buy condition. Please monitor closely.
More details about Solana (SOLUSD)
Recent Events and Risks:
- Concentrated Long Liquidation Pools Near $100 Support: Derivatives heatmap data highlights dense clusters of leveraged long positions concentrated around the $100–$102 range, leaving SOL vulnerable to automated liquidation cascades if selling pressure forces a break below key psychological support.
- MACD Bearish Crossover and Short-Term Momentum Fatigue: Price action has stalled below the $105–$107 resistance cluster, with the daily MACD histogram turning negative (-0.06), signaling weakening momentum and elevated risk of a pullback toward secondary support near $95.56.
- On-Chain Speculative Fee Contraction: On-chain DEX metrics reveal sharp short-term fee and volume drops on speculative trading protocols like PumpSwap and HumidiFi, pointing to a broader slowdown in transaction velocity and retail participation across the Solana ecosystem.
- Regulatory Friction on Tokenized Assets and Exchanges: Ongoing U.S. SEC initiatives targeting transfer agent compliance rules and decentralized exchange operations maintain regulatory pressure on high-throughput Layer-1 networks expanding into tokenized real-world asset trading.
Recommended Articles


