


Ethereum (ETHUSD) Is up 1.28% on Sep 6: Key Drivers to Watch
Ethereum (ETHUSD) is up 1.28% at Sep 6 00:05(ET), now at $2506.64, with a 7-day up of 0.74%.
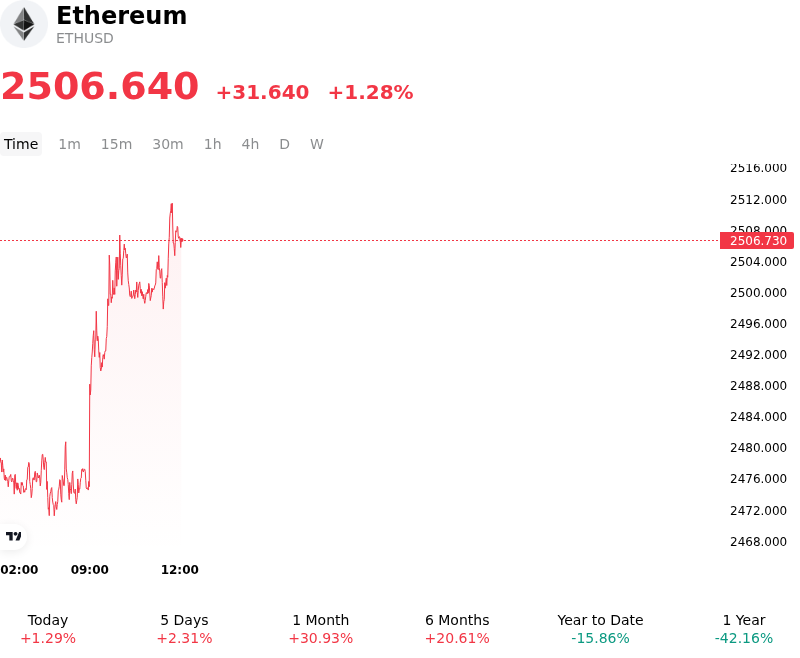
What is driving Ethereum (ETHUSD)’s stock price up today?
Capital flowed into Ethereum as macroeconomic liquidity conditions improved and shifting Federal Reserve policy expectations reinvigorated broader digital asset risk appetite. Commentary from Federal Reserve leadership signaling potential monetary flexibility helped alleviate immediate upward pressure on benchmark Treasury yields and the US dollar. This macroeconomic tailwind created a supportive backdrop for high-beta digital assets, encouraging institutional and systematic market participants to rebuild long exposures.
Institutional participation through spot Ethereum exchange-traded funds reinforced the upward trajectory. Sustained net positive weekly inflows into primary spot ETH ETF products demonstrated persistent baseline demand from traditional asset managers and institutional allocators. This steady fund absorption provided crucial depth to centralized exchange order books, dampening spot selling pressure and establishing a firm floor for price discovery.
On-chain supply dynamics and derivatives market positioning further amplified the advance. With substantial supply locked in native staking protocols, available liquidity on spot exchanges remains structurally constrained, heightening price responsiveness to new capital inflows. Concurrently, robust transaction volume across Ethereum Layer-2 scaling solutions and sustained decentralized finance activity supported fundamental valuation metrics. As spot prices pushed past immediate overhead technical levels, liquidations of short derivatives positions added momentum, triggering systematic buy programs.
While the intraday advance reflects constructive capital flows and improving sentiment, institutional investors continue to evaluate ongoing macroeconomic risks. Future monetary policy shifts, fluctuations in spot ETF demand, and broader regulatory developments remain key variables shaping medium-term market stability.
Technical Analysis of Ethereum (ETHUSD)
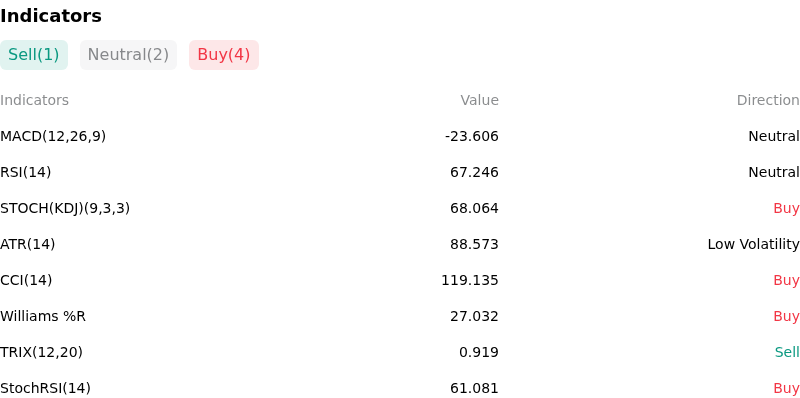
Technically, Ethereum (ETHUSD) shows a MACD (12,26,9) value of -23.606, indicating a neutral signal. The RSI at 67.246 suggests neutral condition and the Williams %R at 27.032 suggests buy condition. Please monitor closely.
More details about Ethereum (ETHUSD)
Recent Events and Risks:
- Whale Exchange Deposits and Sell-Side Overhang: On-chain tracking highlighted massive whale wallet transfers to centralized trading venues, including a deposit of 70,739 ETH (valued at $174 million) across Binance, OKX, and Bybit out of a larger 167,855 ETH holding, alongside a $108 million deposit to Coinbase, creating severe sell-side liquidity risks.
- Overcrowded Leveraged Longs and Liquidation Cascade Threat: Derivatives market data indicates that over $1 billion in leveraged long positions remain vulnerable to forced liquidations if ETH breaches crucial support around $2,350–$2,400, exacerbated by concentrated high-leverage whale positions with liquidation prices near $2,241.
- Spot ETF Outflows and Institutional Demand Slowdown: U.S. spot Ethereum exchange-traded funds recently broke a 12-day consecutive inflow streak by posting $48.2 million in daily net outflows, pointing to softening institutional spot allocations and increasing divergence relative to Bitcoin capital inflows.
- Macroeconomic Risk-Off Pressures and Rate Expectations: Persistent macro uncertainty stemming from elevated U.S. Treasury yields, sustained oil price levels above $95, and cautious expectations around Federal Reserve monetary policy continue to weigh on broader digital asset risk sentiment and limit altcoin capital inflows.
Recommended Articles


