


Pershing Square Ord Shs Stock (PS) Moved Down by 7.46% on Aug 14: What Signal Does It Send?
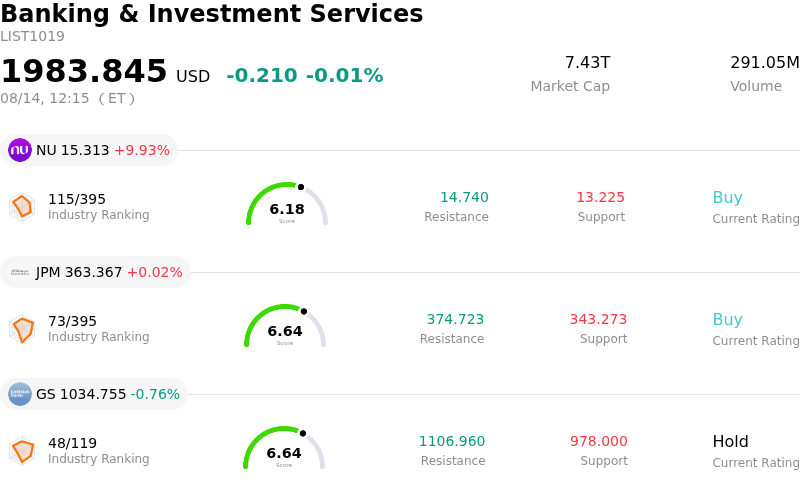
Pershing Square Ord Shs (PS) moved down by 7.46%. The Banking & Investment Services sector is down by 0.01%. The company underperformed the industry. Top 3 stocks by turnover in the sector: Nu Holdings Ltd (NU) up 9.93%; JPMorgan Chase & Co (JPM) up 0.02%; Goldman Sachs Group Inc (GS) down 0.76%.
What is driving Pershing Square Ord Shs (PS)’s stock price down today?
Pershing Square Inc. experienced notable downward pressure during trading, primarily driven by investor reactions to its quarterly financial report and underlying operational disclosures. While the asset manager delivered distributable earnings that exceeded analyst projections due to steady fee-paying asset growth, top-line revenue fell short of consensus expectations. The revenue disappointment led market participants to reassess near-term financial projections, initiating a sell-off as institutional investors adjusted their positions following the earnings release.
Compounding the top-line shortfall, the underlying GAAP results revealed significant net losses driven by non-operating factors. Unrealized fair value losses across major portfolio holdings, including mark-to-market declines in affiliated vehicles, created substantial headline friction. Additionally, elevated balance sheet leverage and contra-revenue amortization charges associated with initial public offering structures underscored the variance between cash distributable metrics and statutory accounting results, tempering enthusiasm despite positive operating cash flows.
Valuation considerations also weighed heavily on market sentiment. Wall Street analysts highlighted that the stock was trading at an elevated price-to-sales multiple compared to industry peers, leaving little margin for operational error. Furthermore, discussions regarding persistent trading discounts to net asset value among its primary investment vehicles and strategic product expansion into pre-IPO venture funds prompted cautious profit-taking. The combination of top-line revenue misses, GAAP accounting friction, and valuation contraction culminated in aggressive intraday volatility.
Technical Analysis of Pershing Square Ord Shs (PS)
Technically, Pershing Square Ord Shs (PS) shows a MACD (12,26,9) value of 1.324, indicating a buy signal. The RSI at 69.434 suggests neutral condition and the Williams %R at 7.855 suggests overbought condition. Please monitor closely.
Fundamental Analysis of Pershing Square Ord Shs (PS)
Pershing Square Ord Shs (PS) is in the Banking & Investment Services industry. Its latest annual revenue is $348.77M, ranking 86 in the industry. The net profit is $249.78M, ranking 54 in the industry. Company Profile
Over the past month, multiple analysts have rated the company as Buy, with an average price target of $41.25, a high of $49.00, and a low of $34.00.
More details about Pershing Square Ord Shs (PS)
Company Specific Risks:
- Elevated Valuation and Profitability Pressures: Following the Q2 2026 earnings report, Pershing Square's Price-to-Sales ratio reached an elevated 21.14x, exposing the stock to valuation contraction given persistent GAAP profitability challenges and low historical profit margins.
- AUM Redemptions and Capital Shift Volatility: The Q2 2026 8-K filing highlighted total AUM outflows of $354 million and fee-paying AUM redemptions of $273 million from funds PSLP and PSINTL as capital was repurposed for the PSUS IPO, creating volatility in baseline recurring fee structures.
- Margin Compression from New Venture Strategy: The August 13 announcement of Pershing Square Ventures introduces execution risks by shifting into pre-IPO venture investing under a discounted fee structure, which may dilute higher-margin management fee streams from traditional strategies.
- Subdued Institutional Outlook and Price Volatility: Institutional analysts maintain a consensus "Hold" rating following quarterly results, driving wide intraday trading swings between $37.42 and $43.00 amid market skepticism surrounding long-term distributable earnings trajectory.
Recommended Articles


