


Ethereum (ETHUSD) Is down 1.01% on Aug 14: Key Drivers to Watch
Ethereum (ETHUSD) is down 1.01% at Aug 14 09:55(ET), now at $1864.97, with a 7-day down of 2.48%.
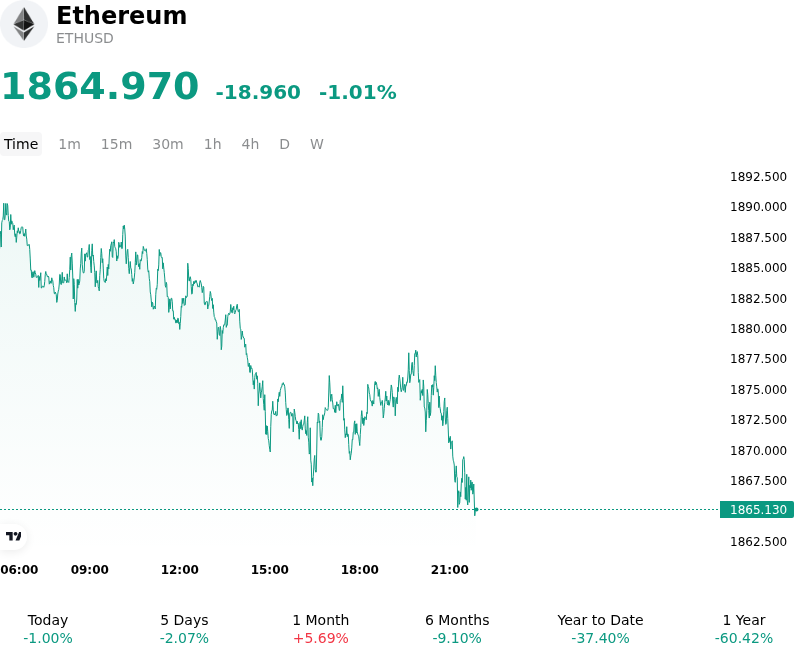
What is driving Ethereum (ETHUSD)’s stock price down today?
Investors trimmed exposure to Ethereum as price action ran into heavy overhead supply near key psychological resistance levels. Repeated rejections at short-term technical hurdles triggered profit-taking among derivative and spot market participants, creating an intraday liquidity imbalance toward short-term selling. While underlying spot Ethereum ETF flows remained net positive, the daily pace of institutional inflows moderated relative to previous weekly spikes, leaving the market without sufficient spot buying power to absorb the overhead selling pressure.
Macroeconomic caution and persistent regulatory overhangs contributed to the selective risk reduction. Broader digital asset sentiment was constrained by ongoing policy uncertainty and legislative delays surrounding digital asset regulatory frameworks, prompting institutional desks to maintain a conservative exposure profile. Higher real Treasury yields and dollar strength also weighed on broader risk sentiment, discouraging speculative leverage expansion across major altcoin pairs. Consequently, derivatives markets experienced modest long liquidations, further leaning the order book toward downside price discovery.
Despite the short-term pullback, Ethereum's structural supply-demand dynamics continue to show long-term resilience. Network staking participation remains at near-record levels with roughly one-third of total circulating supply locked in validators, restricting liquid exchange supply. Additionally, ongoing protocol developments focused on post-quantum cryptographic security and upcoming Layer 1 scaling upgrades reinforce the long-term adoption thesis. Nevertheless, until institutional spot ETF flows reaccelerate significantly or macro liquidity conditions ease, ETH remains bound by overhead technical resistance and tactical profit-taking.
Technical Analysis of Ethereum (ETHUSD)
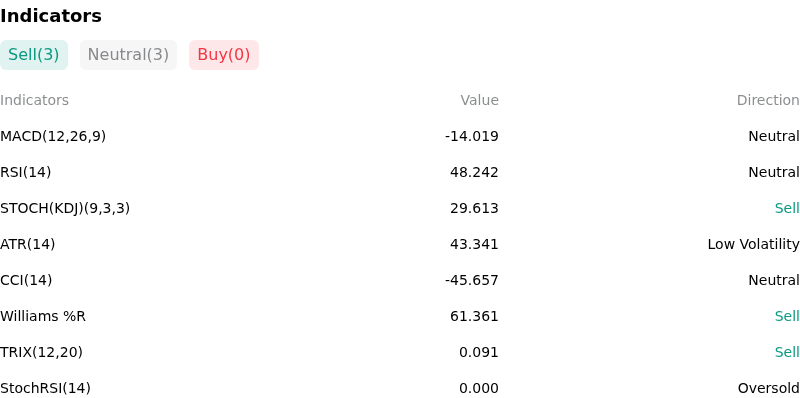
Technically, Ethereum (ETHUSD) shows a MACD (12,26,9) value of -14.019, indicating a neutral signal. The RSI at 48.242 suggests neutral condition and the Williams %R at 61.361 suggests sell condition. Please monitor closely.
More details about Ethereum (ETHUSD)
Recent Events and Risks:
- Regulatory Rulemaking Delay: The U.S. Securities and Exchange Commission abruptly canceled its scheduled meeting to propose "Reg Crypto," its first purpose-built regulatory framework for digital assets. The last-minute postponement leaves issuers without clear eligibility standards or registration exemptions, maintaining regulatory ambiguity across the Ethereum ecosystem.
- Technical Support Breach: Ethereum's price action has deteriorated toward key technical support around the 50-day Exponential Moving Average at $1,865. Momentum indicators like the MACD and RSI show persistent downside pressure, raising the probability of a broader technical breakdown toward lower retracement zones.
- Whale Capitulation and Exchange Inflows: Recent on-chain monitoring revealed multi-year whale wallet capitulation, including large-scale liquidations realized at heavy losses alongside recurring high-net-worth wallet transfers to major central exchanges. These large spot transfers add significant overhead supply pressure to the order books.
- Derivatives Overhang and Liquidation Risk: Market leverage remains concentrated around key price levels, with over $580 million in long positions vulnerable to forced liquidations if ETH breaks key lower support bounds. Compounded by thin summer liquidity, this exposure elevates the risk of intraday long squeezes and cascading sell-offs.
Recommended Articles


