


BHP Group Ltd Stock (BHP) Closed Down by 3.19% on Aug 13: A Full Analysis
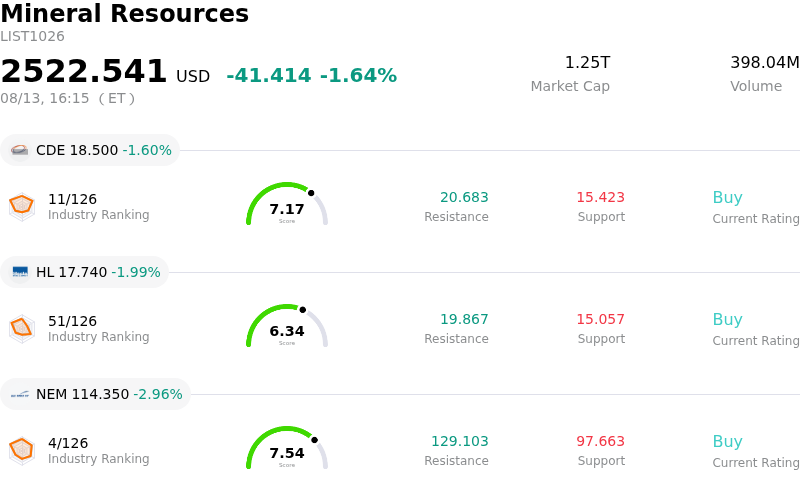
BHP Group Ltd (BHP) closed down by 3.19%. The Mineral Resources sector is down by 1.64%. The company underperformed the industry. Top 3 stocks by turnover in the sector: Coeur Mining Inc (CDE) down 1.60%; Hecla Mining Co (HL) down 1.99%; Newmont Corporation (NEM) down 2.96%.
What is driving BHP Group Ltd (BHP)’s stock price down today?
The decline in BHP Group's share price was primarily driven by softness in key underlying commodity markets, particularly iron ore, combined with broader market consolidation. Weakening profitability among major steel producers in China has sustained production curtailments, placing downward pressure on spot iron ore benchmarks. Given that iron ore remains a primary driver of BHP's overall revenues and cash flow, subdued near-term demand expectations weighed heavily on investor sentiment across the materials sector.
Additionally, the pullback reflects profit-taking ahead of the company's upcoming full-year financial results announcement. Following a prolonged rally that pushed the equity near multi-month highs—driven by elevated copper prices and record operational volumes—investors chose to lock in gains and de-risk positions. High market expectations regarding the final dividend payout and initial guidance for the next fiscal year created a challenging hurdle, leading institutional participants to adopt a more conservative stance before the earnings catalyst.
Cost-side uncertainties and sector-wide risk aversion further compounded the downward pressure. Elevated energy expenses, driven by geopolitical friction in the Middle East, alongside persistent scrutiny over capital expenditure requirements for large-scale development projects like the Jansen potash asset, served as additional friction points. As commodity indices experienced short-term consolidation, the combination of cautious pre-earnings positioning, margin sensitivity, and softer industrial metal trends catalyzed the stock's lower movement.
Technical Analysis of BHP Group Ltd (BHP)
Technically, BHP Group Ltd (BHP) shows a MACD (12,26,9) value of 1.386, indicating a buy signal. The RSI at 61.697 suggests neutral condition and the Williams %R at 14.863 suggests overbought condition. Please monitor closely.
Fundamental Analysis of BHP Group Ltd (BHP)
BHP Group Ltd (BHP) is in the Mineral Resources industry. Its latest annual revenue is $51.26B, ranking 3 in the industry. The net profit is $9.02B, ranking 2 in the industry. Company Profile
Over the past month, multiple analysts have rated the company as Hold, with an average price target of $74.75, a high of $91.00, and a low of $56.50.
More details about BHP Group Ltd (BHP)
Company Specific Risks:
- Port Hedland Labor Disruption Risks: Industrial action and union strike threats at BHP's critical Port Hedland iron ore export hub risk disrupting shipment schedules, reducing export volumes, and elevating logistics and labor costs.
- Potash Project Cost Overruns and Impairment: Substantial capital expenditure inflation and construction delays at the Jansen Stage 2 potash project in Canada resulted in a $2.3 billion asset write-down, signaling execution vulnerabilities in key growth and diversification assets.
- Analyst Downgrades and Earnings Estimate Cuts: Brokerages including Erste Group and Wall Street Zen recently downgraded BHP and cut forward FY2026/FY2027 earnings per share forecasts below consensus, citing muted earnings momentum and elevated valuation multiples.
- Commodity Pricing Headwinds and Projected Volume Step-Downs: Institutional research highlights risks from weaker second-half realized iron ore prices and anticipated volume moderation in key copper assets, threatening to compress profit margins and limit variable dividend payouts ahead of full-year financial results.
Recommended Articles


