


XRP (XRPUSD) Is down 1.04% on Aug 12: Key Drivers to Watch
XRP (XRPUSD) is down 1.04% at Aug 12 15:25(ET), now at $1.0068, with a 7-day down of 5.86%.
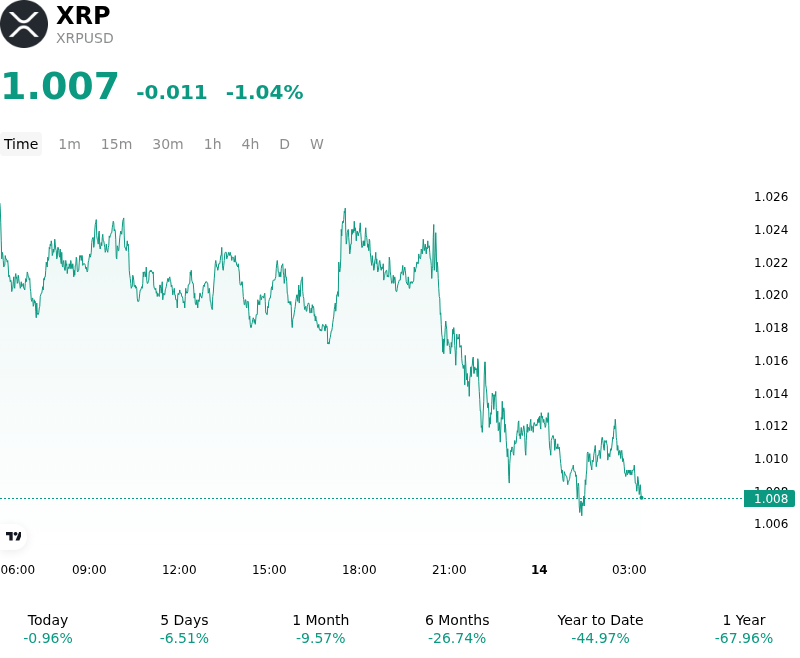
What is driving XRP (XRPUSD)’s stock price down today?
The downward pressure on XRP reflects a combination of decelerating institutional spot ETF inflows, cautious derivatives positioning, and broader macro market consolidation. Recent flow data indicates a noticeable slowdown in spot XRP ETF allocations relative to prior weeks, diminishing the steady institutional buy-side support that had previously anchored price levels. Although macroeconomic conditions stabilized as U.S. inflation figures printed inline with market expectations, the absence of an unexpected dovish catalyst left the broader digital asset sector without a compelling macro impulse to absorb persistent overhead liquidity.
Regulatory sentiment continues to act as a key headwind, as market participants re-evaluate the timeline and probability of favorable U.S. legislative milestones, such as the pending CLARITY Act. Procedural delays and legislative uncertainty ahead of upcoming congressional votes have led traders to trim risk exposure and unwound part of the speculative premium previously priced into the asset. Additionally, while enterprise adoption metrics and institutional stablecoin issuance across the ecosystem remain steady, institutional capital flows have increasingly segregated underlying network infrastructure usage from direct spot token demand.
On-chain metrics and derivatives market positioning highlight ongoing deleveraging and structural rebalancing. A modest liquidation of leveraged long positions near critical technical support zones contributed to heightened intraday volatility, compelling short-term derivatives traders to derisk. Although persistent whale wallet accumulation signals underlying baseline conviction among large-scale holders, near-term price discovery remains constrained by disciplined institutional capital allocation, elevated real interest rates, and cautious sentiment across major altcoin markets.
Technical Analysis of XRP (XRPUSD)
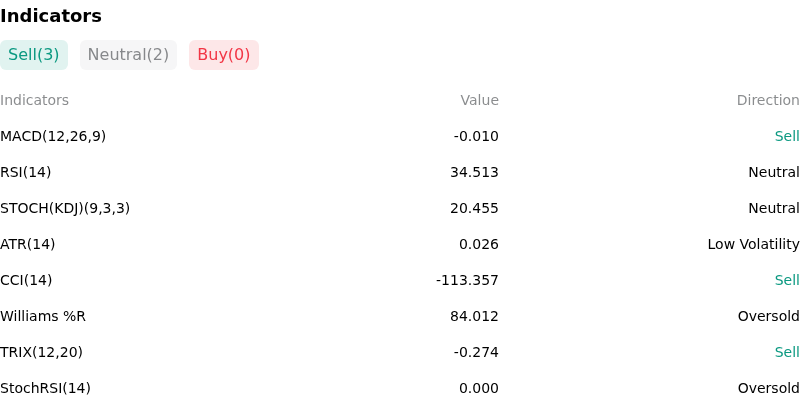
Technically, XRP (XRPUSD) shows a MACD (12,26,9) value of -0.010, indicating a sell signal. The RSI at 34.513 suggests neutral condition and the Williams %R at 84.012 suggests oversold condition. Please monitor closely.
More details about XRP (XRPUSD)
Recent Events and Risks:
- Derivatives Over-Leverage and Long Liquidation Exposure: XRP perpetual futures funding rates spiked over 200% as open interest climbed toward $883.8 million, leaving heavy speculative long positioning vulnerable to cascading liquidations after more than $11 million in long positions were liquidated as price tested the $1.00 support level.
- Institutional ETF Flow Collapse: Weekly net inflows into U.S. spot XRP exchange-traded funds plunged by 93% to just $1.01 million, with multiple recent trading sessions logging zero net inflows, indicating a severe drop in institutional spot demand.
- Legislative Delay and Regulatory Catalysts Stalled: The U.S. Senate postponed consideration of the CLARITY Act until September, removing an expected near-term regulatory market-structure catalyst and prolonging statutory ambiguity for the token.
- On-Chain Ledger Contraction and Exchange Inflows: XRP Ledger daily transaction activity fell over 40% in recent days alongside heightened whale transfers into centralized exchanges, pointing to weakening network utility and rising overhead spot selling risks.
Recommended Articles


