


Solana (SOLUSD) Is down 1.32% on Aug 6: What Are the Risk Factors?
Solana (SOLUSD) is down 1.32% at Aug 6 00:05(ET), now at $72.41, with a 7-day down of 1.47%.
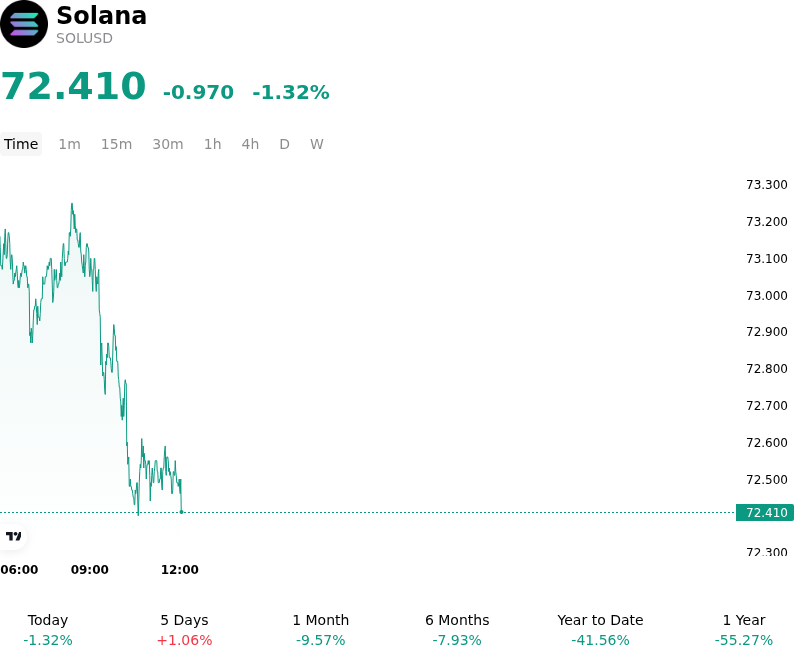
What is driving Solana (SOLUSD)’s stock price down today?
The intraday volatility in Solana reflects a broader de-risking trend across the digital asset landscape, primarily driven by a repricing of global liquidity expectations and a shift in institutional risk appetite. As U.S. Treasury yields maintain upward pressure, the opportunity cost of holding high-beta Layer-1 assets has increased, prompting a cautious reallocation of capital. The relative strength of the U.S. Dollar has further constrained capital flows into high-growth blockchain ecosystems, leading to a localized reduction in spot demand from global participants.
On-chain metrics indicate a temporary cooling in decentralized exchange volumes and fee generation within the Solana ecosystem. This softening in activity follows a period of high speculative intensity, suggesting that investors are currently in a profit-taking phase as they reassess the immediate trajectory of network growth. The lack of immediate bullish catalysts, such as major protocol upgrade milestones or new institutional product announcements, has left the asset susceptible to downward pressure from short-term traders.
From a market structure perspective, the price action was exacerbated by the liquidation of leveraged long positions in the derivatives market. Elevated funding rates heading into the session indicated an overcrowded long trade, which provided the necessary fuel for a quick move lower as stop-loss orders were triggered. This forced deleveraging typically occurs when liquidity thinness meets a shift in sentiment, causing price swings that are disconnected from long-term fundamental value but reflective of current positioning imbalances.
Institutional investors are also monitoring the broader regulatory climate and the pace of spot ETF flows for major digital assets, which sets the tone for the entire sector. Any perceived delay in the expansion of crypto-linked financial products or uncertainty regarding the regulatory classification of ecosystem tokens tends to weigh more heavily on Solana due to its high correlation with retail and venture capital sentiment.
The current movement appears to be a technical and liquidity-driven correction rather than a shift in the long-term structural narrative. While the ecosystem continues to lead in throughput and hardware integration, the near-term outlook remains sensitive to macroeconomic shifts and the Federal Reserve's stance on interest rates. Market participants will likely continue to watch for a stabilization in network activity and a reduction in derivatives leverage as signs that the current period of volatility has run its course.
Technical Analysis of Solana (SOLUSD)
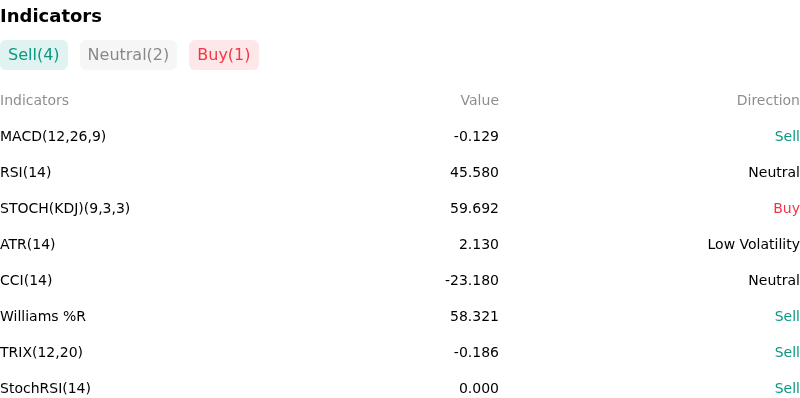
Technically, Solana (SOLUSD) shows a MACD (12,26,9) value of -0.129, indicating a sell signal. The RSI at 45.580 suggests neutral condition and the Williams %R at 58.321 suggests sell condition. Please monitor closely.
More details about Solana (SOLUSD)
Recent Events and Risks:
- Regulatory Overhang and Security Classification: The SEC’s continued classification of SOL as a security in ongoing litigation against major exchanges like Coinbase and Binance remains a significant downside risk, as it creates legal uncertainty for U.S.-based institutional investors and potential delisting threats for domestic trading platforms.
- Institutional Capital Rotation: Following the recent regulatory progress and approval milestones for spot Ethereum ETFs, market participants are observing a "rotation trade" where liquidity is shifting from Solana into Ethereum, resulting in downward pressure on the SOL/ETH cross-pair and a decrease in relative buy-side demand.
- Network Reliability Concerns: Despite recent v1.18 updates, the network continues to face scrutiny regarding its ability to handle extreme transaction surges driven by meme coin volatility; persistent high rates of failed non-vote transactions risk damaging user confidence and the perceived stability of the protocol.
- Speculative Bubble Unwind: A high concentration of on-chain activity is currently linked to hyper-speculative meme coin launches; a sharp decline in retail participation or a liquidity crunch in these high-risk assets could trigger a rapid deleveraging event, leading to significant SOL price volatility as traders exit positions to cover losses.
Recommended Articles


