


XRP (XRPUSD) Is down 3.03% on Jul 28: Here Is Why
XRP (XRPUSD) is down 3.03% at Jul 28 00:10(ET), now at $1.0579, with a 7-day down of 7.90%.
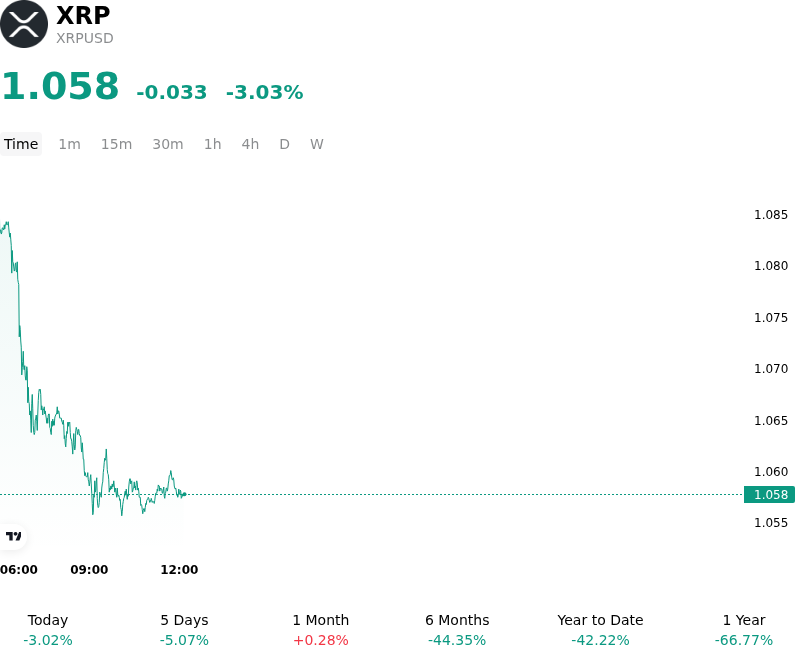
What is driving XRP (XRPUSD)’s stock price down today?
The decline in XRP is primarily attributed to a confluence of regulatory overhang and a shift in global macro liquidity conditions. Despite the maturation of the digital asset market by mid-2026, XRP remains uniquely sensitive to developments surrounding the legal framework for cross-border payment protocols. Investors appear to be reducing exposure in response to a lack of definitive progress regarding the complete resolution of long-standing litigation or fresh regulatory scrutiny, which continues to act as a barrier to full-scale institutional integration within the traditional banking sector.
Macroeconomic factors are also playing a significant role in the current intraday volatility. A recent uptick in U.S. Treasury yields, fueled by expectations of a more prolonged restrictive monetary policy stance by the Federal Reserve, has bolstered the U.S. dollar. This strengthening of the greenback typically exerts downward pressure on the broader cryptocurrency complex, with XRP experiencing heightened sensitivity due to its role as a bridge currency. The resulting drain in liquidity has triggered a deleveraging event in the derivatives market, where an accumulation of long positions was liquidated as the price breached key support levels.
Furthermore, the momentum associated with institutional adoption via spot exchange-traded products has seen a temporary cooling. Stagnating inflow data suggests that large-scale allocators are adopting a more cautious wait-and-see approach, shifting capital toward perceived safe-haven assets or more established market leaders. This rotation reflects a broader risk-off sentiment across the digital asset ecosystem, as participants recalibrate their portfolios in anticipation of upcoming economic data releases that may impact global liquidity.
On-chain activity also indicates a slowdown in large-scale transactions, suggesting that institutional participants may be moving toward a distribution phase rather than accumulation. Without a fresh catalyst related to the expansion of the XRP Ledger or new institutional stablecoin initiatives, the market is struggling to maintain upward momentum. The current price action underscores the persistent tension between long-term adoption narratives and the immediate pressures of liquidity repricing and regulatory uncertainty.
Technical Analysis of XRP (XRPUSD)
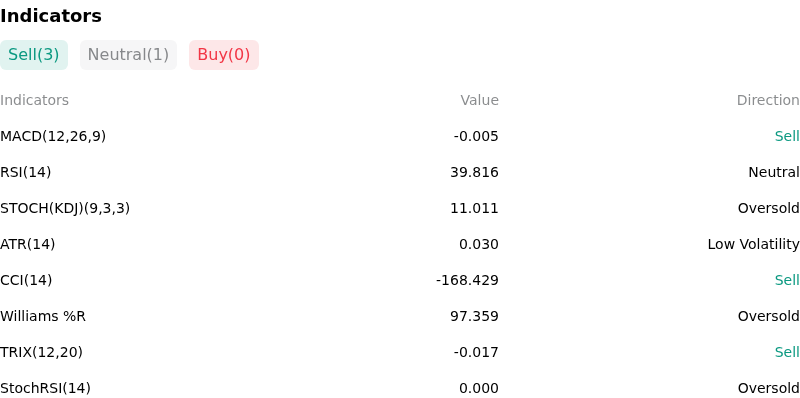
Technically, XRP (XRPUSD) shows a MACD (12,26,9) value of -0.005, indicating a sell signal. The RSI at 39.863 suggests neutral condition and the Williams %R at 97.086 suggests oversold condition. Please monitor closely.
More details about XRP (XRPUSD)
p>Recent Events and Risks:
- Regulatory Litigation Overhang: The ongoing legal dispute between Ripple and the SEC continues to generate downside pressure as market participants react to the SEC’s persistent efforts to secure a $2 billion fine and the potential for a future appeal against the programmatic sales ruling, creating a glass ceiling for institutional adoption.
- Concentrated Whale Liquidation: On-chain monitoring has detected significant movements of XRP from private wallets to centralized exchanges, including a notable transfer of over 150 million XRP to Bitstamp and Binance within the last 48 hours, signaling an increase in immediate sell-side liquidity that may trigger a price breakdown.
- Institutional Inflow Divergence: XRP is experiencing a loss of market share and liquidity as institutional capital rotates into Bitcoin and Ethereum ETFs; the lack of a clear regulatory pathway for a spot XRP ETF in the U.S. remains a significant competitive disadvantage that heightens volatility during risk-off market periods.
- Derivatives Market Fragility: Current market structure shows a build-up of leveraged long positions at critical support levels; a failure to maintain these levels risks a liquidation cascade that could disproportionately impact XRPUSD relative to other large-cap assets due to thinner order book depth on major trading pairs.
Recommended Articles


