


WTI Futures (USOIL-F) Is down 6.48% on Jul 26: Key Drivers to Watch
WTI Futures (USOIL-F) is down 6.48% at Jul 26 18:10(ET), now at $84.56, with a 7-day up of 3.48%.
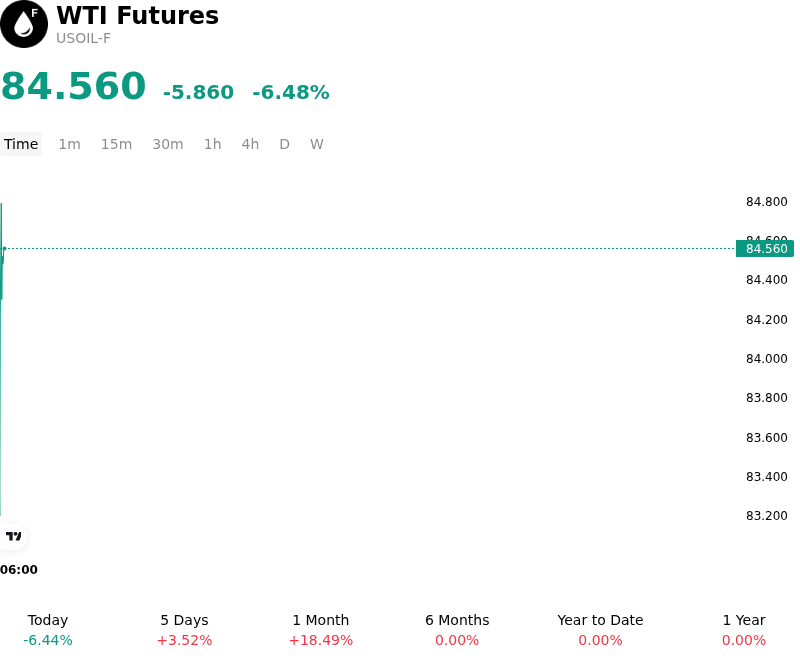
What is driving WTI Futures (USOIL-F)’s stock price down today?
The sharp decline in WTI crude oil prices is primarily driven by a significant shift in the global supply-demand balance outlook, triggered by reports of an unexpected breakdown in OPEC+ production discipline. Market intelligence suggests that key member nations have begun to exceed their voluntary production quotas, leading to fears that the alliance's cohesive strategy to support prices through supply constraints is fracturing. This development has forced a rapid repricing of the market balance for the remainder of the year, transitioning the outlook from a projected deficit to a potential surplus.
Compounding the supply-side pressure is a notable de-escalation in geopolitical tensions across the Middle East. The sudden announcement of progress toward a comprehensive ceasefire agreement in a major regional conflict has led to the immediate unwinding of the geopolitical risk premium that had been integrated into front-month contracts. As the perceived threat to maritime logistics and critical energy infrastructure in the Persian Gulf dissipates, institutional investors have aggressively liquidated long positions, accelerating the downward momentum through a wave of technical stop-loss triggers.
On the demand side, recent data releases from major Asian economies have signaled a sharper-than-expected slowdown in refinery throughput and industrial energy consumption. The combination of cooling manufacturing activity and rising inventory levels in commercial hubs suggests that the seasonal peak in summer travel demand has failed to offset broader structural weaknesses. This demand-side fragility, when paired with the prospect of increased barrels entering the market, has significantly soured sentiment toward the energy complex.
Macroeconomic headwinds are further exacerbating the sell-off. A stronger-than-anticipated US dollar has increased the cost of dollar-denominated commodities for international buyers, while hawkish commentary from Federal Reserve officials has renewed concerns regarding a global economic slowdown. The convergence of these factors suggests that the current move reflects a fundamental realignment of expectations as the market transitions toward a more oversupplied environment in the medium term. Investors are now focused on upcoming inventory reports to confirm whether the build in physical stocks justifies a continued bearish stance.
Technical Analysis of WTI Futures (USOIL-F)
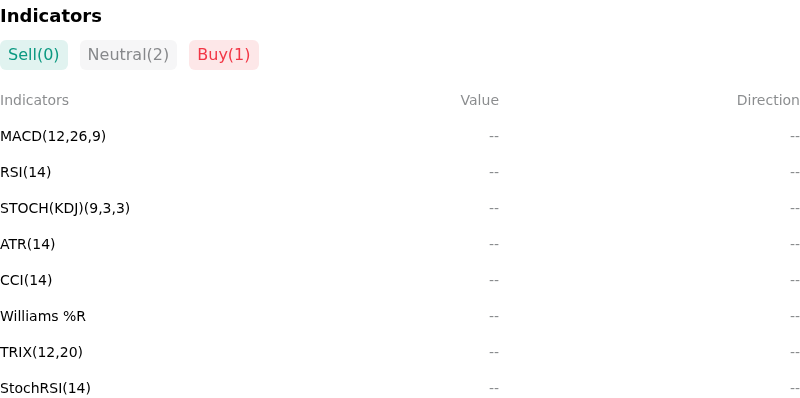
Technically, WTI Futures (USOIL-F) shows a MACD (12,26,9) value of 0.000, indicating a neutral signal. The RSI at 66.070 suggests neutral condition and the Williams %R at 12.204 suggests overbought condition. Please monitor closely.
More details about WTI Futures (USOIL-F)
Recent Events and Risks:
- Surplus Inventory Pressure: Recent U.S. Energy Information Administration (EIA) data indicating a surprise build in commercial crude inventories, alongside rising gasoline stocks, signals a potential mismatch between immediate supply and domestic refining demand, exerting downward pressure on WTI spot prices.
- Libyan Production Recovery: The rapid restoration of Libyan crude output toward its 1.2 million barrels per day capacity following the resolution of central bank leadership disputes has removed a key supply-side risk premium and increased physical availability in the Atlantic Basin, contributing to near-term price consolidation.
- Weakening Chinese Macro Indicators: Persistent weakness in China’s manufacturing purchasing managers' index (PMI) and lower-than-expected refinery throughput rates suggest a structural slowdown in the world’s largest oil importer, weighing heavily on global demand forecasts and triggering sell-offs in energy-linked instruments.
- OPEC+ Strategy Uncertainty: Market concerns regarding the eventual unwinding of voluntary production cuts by OPEC+ members in early 2025 are creating a bearish overhang, as traders fear the market will struggle to absorb additional barrels amid slowing global consumption growth and rising non-OPEC supply.
Recommended Articles


