


Texas Instruments Inc Stock (TXN) Moved Down by 3.42% on Jul 7: Key Drivers Unveiled
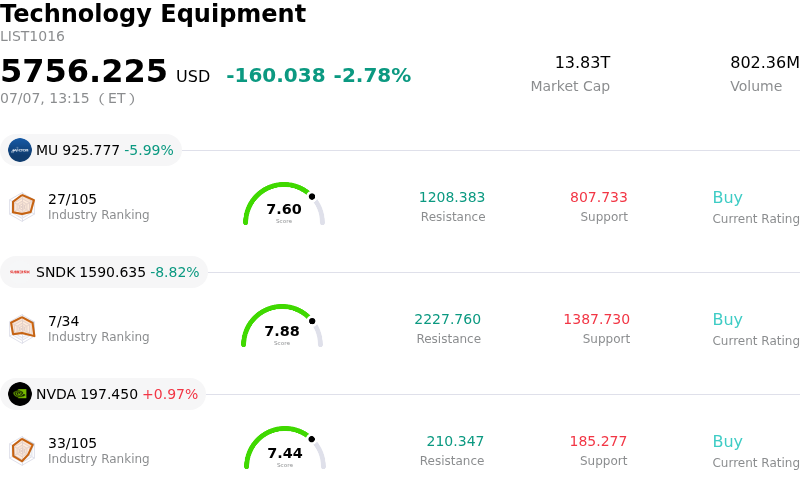
Texas Instruments Inc (TXN) moved down by 3.42%. The Technology Equipment sector is down by 2.78%. The company underperformed the industry. Top 3 stocks by turnover in the sector: Micron Technology Inc (MU) down 5.99%; SanDisk Corporation (SNDK) down 8.82%; NVIDIA Corp (NVDA) up 0.69%.
What is driving Texas Instruments Inc (TXN)’s stock price down today?
Texas Instruments experienced significant intraday volatility and a notable downward move, ending the session in negative territory. This decline comes despite several positive fundamental developments and represents a combination of short-term technical pressures, insider activity, and market consolidation following a massive year-to-date rally.
A key driver of the downward pressure is technical in nature. The stock recently triggered a bearish technical signal as its short-term moving average crossed below its longer-term average, forming a death cross. This indicator has introduced short-term selling pressure from algorithmic and trend-following traders, overshadowing recent positive fundamental news. Additionally, options market metrics show that both the implied volatility rank and percentile have surged to their yearly highs, reflecting heightened investor anxiety and driving significant intraday price swings.
Furthermore, recent institutional and insider activity has weighed on market sentiment. Securities and Exchange Commission filings revealed over eighty-five million dollars in executive stock liquidations over the past quarter. This aggressive insider selling, which includes a substantial position reduction by the retiring Chief Financial Officer ahead of the formal transition in August, has fueled strategic anxieties and prompted some investors to lock in profits.
This profit-taking is also a reaction to the stock’s rich valuation. Driven by robust artificial intelligence infrastructure demand for analog power chips and data center solutions, the stock had surged near all-time highs earlier in the year, trading at a forward earnings multiple of nearly thirty-nine times. This high valuation has made the equity highly sensitive to any signs of potential overvaluation or consolidation. Analysts remain sharply divided, with a consensus rating sitting at a moderate buy or hold, indicating that the stock may have priced in much of its near-term recovery.
Additionally, while the company has announced price increases for its signal-chain and power semiconductor products starting this July to capture strong AI server demand, concerns persist regarding margin compression. Analysts caution that a projected three hundred and fifty million dollar step-up in depreciation expenses for the year, stemming from the company's extensive domestic wafer manufacturing buildout, could pressure gross margins if cyclical demand in the automotive or industrial sectors softens. Investors are also keeping a close eye on capital allocation risks associated with the integration of Silicon Labs, which could delay the anticipated free cash flow recovery. These combined factors triggered a wave of cautious positioning and profit-taking, leading to the observed decline.
Technical Analysis of Texas Instruments Inc (TXN)
Technically, Texas Instruments Inc (TXN) shows a MACD (12,26,9) value of -3.804, indicating a neutral signal. The RSI at 52.069 suggests neutral condition and the Williams %R at 52.412 suggests neutral condition. Please monitor closely.
Media Coverage of Texas Instruments Inc (TXN)
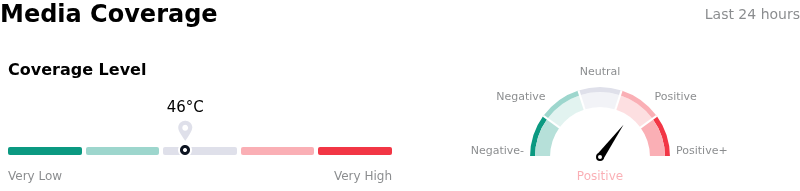
In terms of media coverage, Texas Instruments Inc (TXN) shows a coverage score of 46, indicating a moderate level of media attention. The overall market sentiment index is currently in bullish zone.
Fundamental Analysis of Texas Instruments Inc (TXN)
Texas Instruments Inc (TXN) is in the Technology Equipment industry. Its latest annual revenue is $17.68B, ranking 13 in the industry. The net profit is $4.97B, ranking 9 in the industry. Company Profile
Over the past month, multiple analysts have rated the company as Hold, with an average price target of $286.06, a high of $400.00, and a low of $184.59.
More details about Texas Instruments Inc (TXN)
Company Specific Risks:
- Index Reclassification Liquidity Pressures: Following the company's recent removal from several key Russell value and defensive benchmarks and its subsequent shifting into the growth-oriented Russell 1000 Dynamic and Russell Top 50 indexes, institutional portfolio adjustments are causing near-term demand disruption and compounding selling pressure.
- Severe Valuation Premium and Multiple Stretch: Trading at a trailing P/E ratio of over 50x and a forward P/E of approximately 39x—representing a premium of over 100% relative to its 5-year historical median—the stock is priced for absolute perfection and remains highly susceptible to severe downside if upcoming Q2 earnings or growth forecasts disappoint.
- Imminent Gross Margin Compression: Despite passing the peak of its massive capital expenditure cycle, Texas Instruments faces a projected $350 million step-up in depreciation expenses for 2026, which threatens to trigger immediate gross margin compression if cyclical industrial or automotive demand softens.
- Insider Liquidations and Executive Transition: Rising strategic and transition anxieties have surfaced ahead of the formal CFO hand-off in August 2026, driven by aggressive insider liquidations totaling over $85 million over the past quarter, including a 35.8% position reduction by retiring CFO Rafael Lizardi.
Recommended Articles


