


Dow Jones Industrial Average tags a record, then hides behind its dullest stocks
- DJIA touched a fresh intraday record before reversing to close lower on Tuesday.
- A rotation out of AI and semiconductor names dragged the index off its highs.
- A jump in Crude Oil prices after a Strait of Hormuz attack added to the risk-off tone.
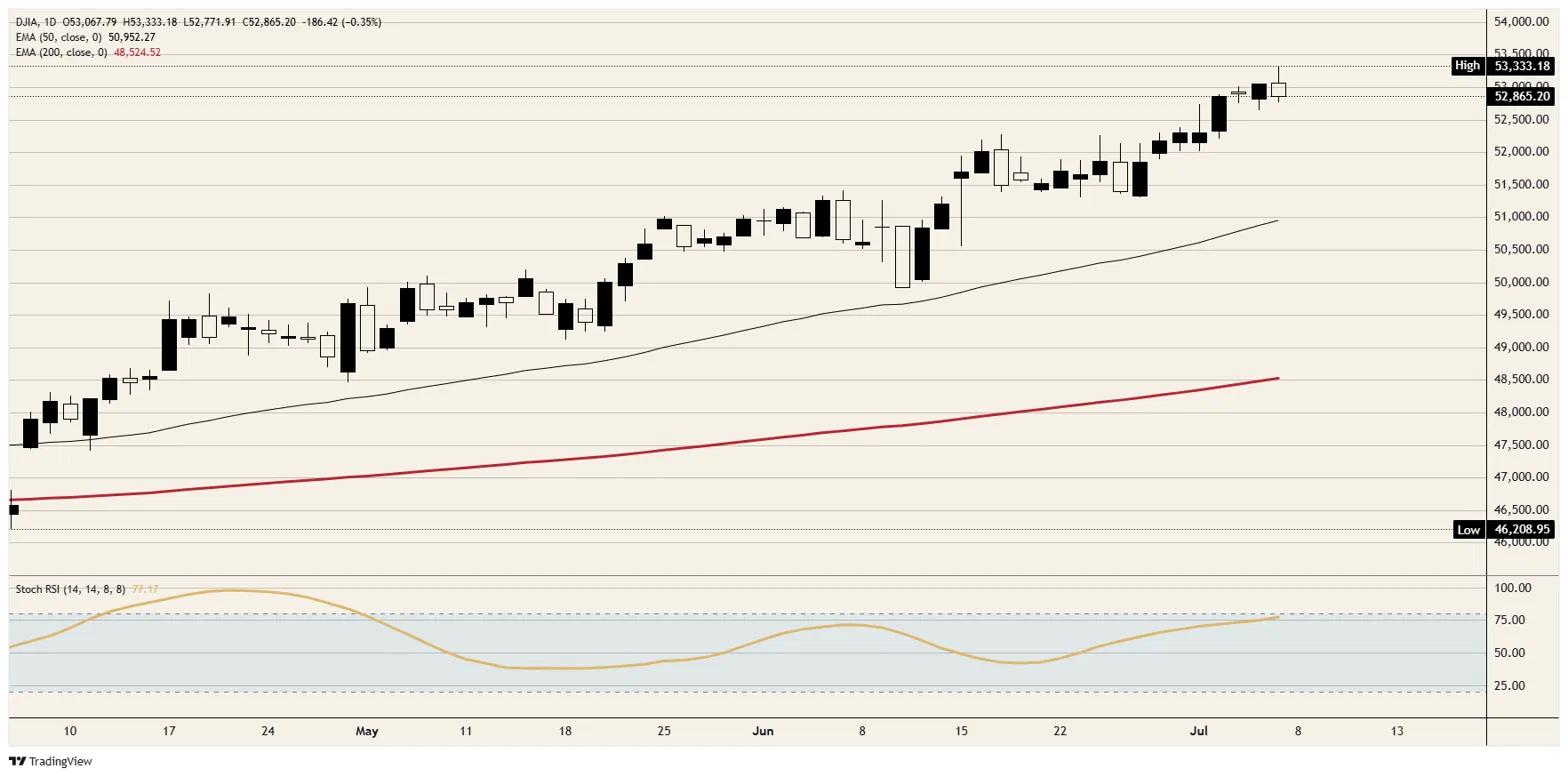
The Dow Jones Industrial Average spent Tuesday arriving late to a party the rest of the market had already begun to leave. The index tagged a fresh intraday record near 53,300 at the New York open around 13:30 GMT, then handed the gains straight back as a rotation out of artificial intelligence (AI) and semiconductor names swept the tape. By the close it had shed more than 500 points from that high, finishing near 52,850 and down about 0.35%, which on Tuesday counted as resilience.
The awkward part is that the record barely outlasted the opening auction, and it survived at all only because of the same stodgy, tech-light makeup that has made the index this year's laggard. The Nasdaq Composite lost more than 1% and the S&P 500 roughly half that, while the Dow's heavier weighting in healthcare, financials and consumer staples did exactly what it is built to do when the fashionable trade breaks.
The chip trade cracked in Asia and travelled west
None of this started on Wall Street; it simply arrived there. South Korea's Kospi fell almost 5% overnight after Samsung slid close to 7%, its record quarterly profit buried beneath fresh worry about spending and chip demand. European technology stocks then shed more than 3%, so US chips opened already carrying two sessions of selling. Micron dropped around 6% and the wider complex fell more than 5%, pulling the Dow's few technology names down with it.
DeepSeek reopens the oldest fear in the trade
Adding to the discomfort, reports that China's DeepSeek is building its own inference chip revived the fear that has always sat beneath the rally, that the sector's biggest customers are quietly designing their own way out. Nvidia slid more than 1%, and the speed of the reaction showed how crowded and one-directional the trade had become.
Crude Oil reopens a file the market had closed
Layered on top of the equity rotation, Crude Oil pushed higher after Iran struck a Qatari liquefied natural gas tanker near the Strait of Hormuz, the chokepoint through which close to a fifth of the world's Crude Oil moves. Brent traded above $73 and West Texas Intermediate (WTI) above $70, both up more than 2%. The market had quietly filed the conflict under resolved; one tanker attack was enough to remind it the US-Iran peace is still only interim.
The money went somewhere less exciting
The cash did not simply leave the AI trade; it went hunting for the parts of the market everyone had been ignoring. Eli Lilly gained about 3%, with JPMorgan and Microsoft also advancing and Walmart up more than 1% after cutting prices on staples such as ground beef and Coca-Cola. That defensive tilt cushioned the Dow, but research desks warn the second-quarter earnings bar now sits uncomfortably high, so the gap between healthy rotation and the first real crack may come down to how the coming results land.
The week still belongs to the minutes
Wednesday brings the Federal Open Market Committee (FOMC) minutes at 18:00 GMT. After a run of hawkish official commentary, including one voting member who leaned notably hawkish on Monday, the market will comb them for any sign the pause has a firm floor beneath it. Weekly initial jobless claims follow Thursday at 12:30 GMT, with the consensus near 218K against 215K prior. Hawkish minutes on stretched valuations and a wobbling AI trade is not the backdrop bulls would have chosen.
Levels to watch
Resistance: The record zone near 53,300 now caps the tape. Rallies into that band are likely to be sold until the semiconductor complex steadies. A daily close back above there reopens room toward 53,500.
Support: The reversal low near 52,750 is the first line to watch. A break there exposes 52,500 and then 52,000. The 50-day Exponential Moving Average (EMA) sits far below near 51,000, keeping this a pullback within an uptrend unless price loses the low 52,000s. The daily Stochastic Relative Strength Index (Stoch RSI) sat near the top of its range as the record printed, so some unwind was overdue.
Bias: Lower in the near term. The trend structure is still higher and the Dow's defensive tilt hands it a cushion the Nasdaq lacks, but a record that could not outlast the opening bell, an overnight semiconductor unwind and Crude Oil back on the geopolitical radar argue for chop and downside rather than fresh highs until the AI trade proves Tuesday was noise, not a turn.
Dow Jones daily chart
Dow Jones FAQs
The Dow Jones Industrial Average, one of the oldest stock market indices in the world, is compiled of the 30 most traded stocks in the US. The index is price-weighted rather than weighted by capitalization. It is calculated by summing the prices of the constituent stocks and dividing them by a factor, currently 0.152. The index was founded by Charles Dow, who also founded the Wall Street Journal. In later years it has been criticized for not being broadly representative enough because it only tracks 30 conglomerates, unlike broader indices such as the S&P 500.
Many different factors drive the Dow Jones Industrial Average (DJIA). The aggregate performance of the component companies revealed in quarterly company earnings reports is the main one. US and global macroeconomic data also contributes as it impacts on investor sentiment. The level of interest rates, set by the Federal Reserve (Fed), also influences the DJIA as it affects the cost of credit, on which many corporations are heavily reliant. Therefore, inflation can be a major driver as well as other metrics which impact the Fed decisions.
Dow Theory is a method for identifying the primary trend of the stock market developed by Charles Dow. A key step is to compare the direction of the Dow Jones Industrial Average (DJIA) and the Dow Jones Transportation Average (DJTA) and only follow trends where both are moving in the same direction. Volume is a confirmatory criteria. The theory uses elements of peak and trough analysis. Dow’s theory posits three trend phases: accumulation, when smart money starts buying or selling; public participation, when the wider public joins in; and distribution, when the smart money exits.
There are a number of ways to trade the DJIA. One is to use ETFs which allow investors to trade the DJIA as a single security, rather than having to buy shares in all 30 constituent companies. A leading example is the SPDR Dow Jones Industrial Average ETF (DIA). DJIA futures contracts enable traders to speculate on the future value of the index and Options provide the right, but not the obligation, to buy or sell the index at a predetermined price in the future. Mutual funds enable investors to buy a share of a diversified portfolio of DJIA stocks thus providing exposure to the overall index.
Recommended Articles


