

Solana (SOLUSD) Is up 2.49% on Jun 29: Why It Happened
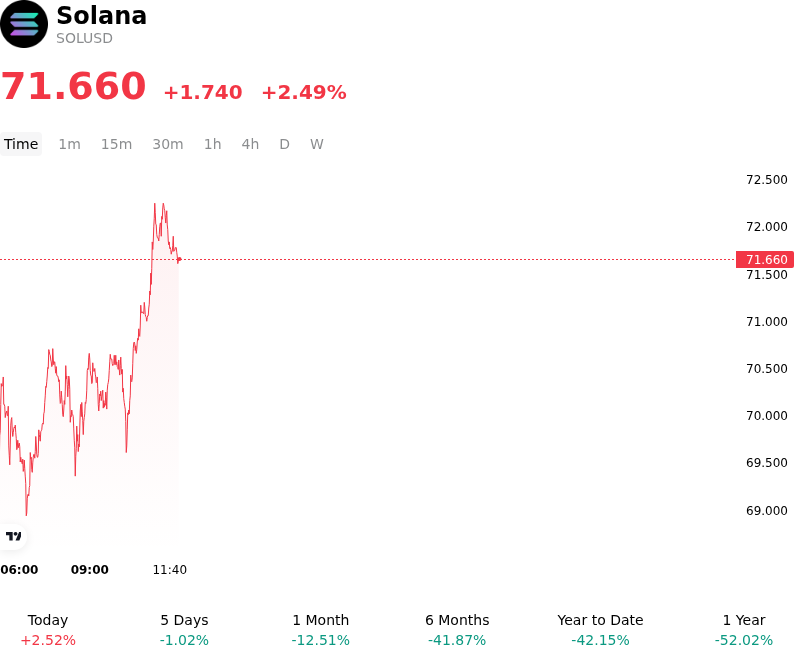
Solana (SOLUSD) is up 2.49% at Jun 29 00:00(ET), now at $71.66, with a 7-day down of 0.24%.
What is driving Solana (SOLUSD)’s stock price up today?
Solana (SOLUSD) experienced a notable intraday advance, demonstrating resilience and structural decoupling from the broader digital asset market. This movement comes in the wake of a severe market-wide liquidation contagion earlier in the week, triggered by Bitcoin's brief slide below fifty-eight thousand dollars, which had dragged SOL below key support levels. The rebound was largely driven by a significant positive shift in investor sentiment surrounding regulatory progress and competitive dynamics within the spot Solana exchange-traded fund landscape.
A primary catalyst for the capital inflows is the rapidly heating competition among spot Solana ETF issuers, particularly regarding the integration of staking yields. Following Morgan Stanley's landmark registration filing for its proposed spot trust, which featured a highly competitive zero point one four percent sponsor fee alongside native staking, other major players have responded aggressively. Grayscale Investments amended its own Solana Staking ETF proposal, drastically lowering its annual sponsor fee to zero point one nine percent and slashing its staking reward retention fee from twenty-three percent to seven percent. Additionally, anticipation around the upcoming launch of the REX-Osprey SOL + Staking ETF has heightened institutional interest. These structural adjustments lower the cost of access and improve net yields for allocators, prompting immediate dip-buying and reinforcing expectations of future capital flows.
Underpinning this price recovery is a widening divergence between Solana's short-term technical price action and its robust on-chain performance. In the second quarter of the year, Solana's on-chain volume surged significantly, driven by enterprise-grade utility and real-world asset tokenization. Recent milestones include Moody's integrating its credit ratings directly into the Solana blockchain for tokenized bonds and fixed-income securities, alongside a network record in daily transaction volume for tokenized equities. Enterprise adoption also gained momentum with payments provider Xweave announcing deployment plans on the network to facilitate stablecoin-powered cross-border settlements for corporate treasurers. This expanding utility, coupled with growing stablecoin dominance, has convinced institutional investors that the network's fundamental adoption thesis remains intact despite temporary macro headwinds.
Despite the positive intraday reversal, institutional allocators continue to monitor critical risks that could cap sustained upside. Market participants remain cautious of technical resistance overhead and persistent selling pressure from larger holders, with on-chain data showing a recent influx of whale-led deposits into centralized exchanges to hedge positions. Furthermore, the market must navigate upcoming token unlocks and potential liquidations from the FTX bankruptcy estate. However, the current price action suggests that long-term buyers are actively pre-positioning to capture the ETF alpha, viewing the recent correction as an attractive entry point given Solana's growing market share in high-throughput decentralized finance.
Technical Analysis of Solana (SOLUSD)
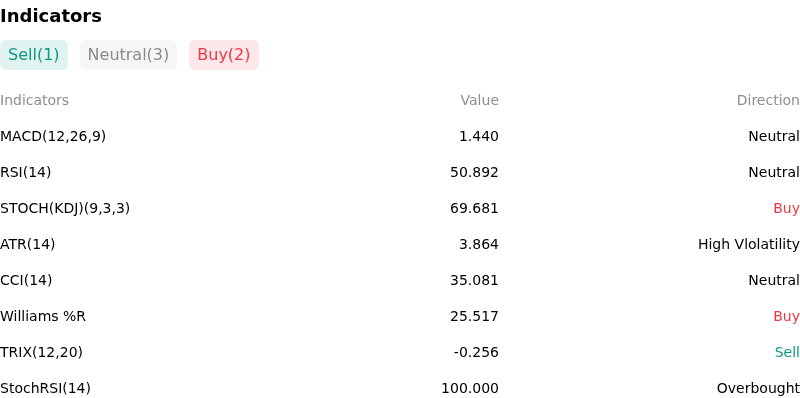
Technically, Solana (SOLUSD) shows a MACD (12,26,9) value of 1.440, indicating a neutral signal. The RSI at 50.892 suggests neutral condition and the Williams %R at 25.517 suggests buy condition. Please monitor closely.
More details about Solana (SOLUSD)
Recent Events and Risks:
- Technical Breakdown and Liquidation Cluster: Following a failure to clear the key $75 resistance zone, SOLUSD completed a bearish double-top pattern and broke below its critical neckline support at $68. This technical breakdown has activated dense clusters of long liquidation stop orders, exposing the asset to heightened intraday volatility and a near-term downside target of $60.80.
- Aggressive Whale Shorting and Leverage Pressures: On-chain derivatives data reveals that whales have established a concentrated $15 million short position on SOL. Analysts warn that Solana's current consolidation around $70 could act as a "bull trap," where a sudden unwind of leveraged long positions could trigger a rapid liquidity flush.
- Surge in Whale-Led Exchange Inflows: On-chain tracking data from the last 72 hours has identified a sudden deposit of approximately 600,000 SOL tokens into centralized exchanges. This influx is part of a broader trend of escalating exchange inflows, signaling that large-scale holders are positioning to sell and increasing localized overhead supply pressure.
- Weakening Institutional Demand and ETF Outflows: Spot Solana ETFs have experienced a distinct weakening in institutional demand, shifting to net outflows of negative $5.8 million for June 2026. This loss of structural buying support, paired with previous high-profile exits like Goldman Sachs completely liquidating its $108 million SOL ETF holdings, removes a crucial price floor.
Recommended Articles


