

Solana (SOLUSD) Is down 1.21% on Jun 18: Key Drivers to Watch
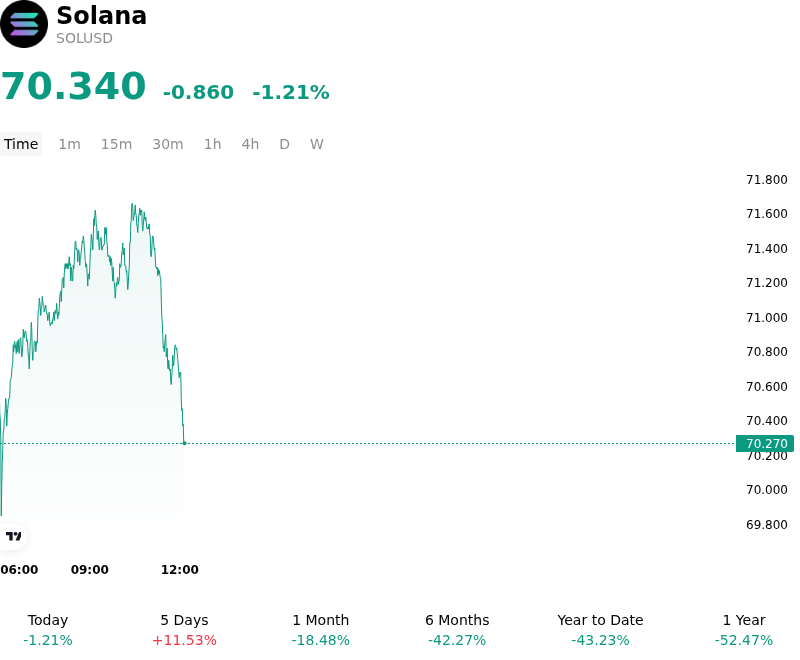
Solana (SOLUSD) is down 1.21% at Jun 18 00:10(ET), now at $70.34, with a 7-day up of 6.09%.
What is driving Solana (SOLUSD)’s stock price down today?
The recent pullback in Solana reflects a confluence of restrictive macroeconomic policy, persistent supply-side overhangs, and a reversal in institutional appetite. Global macro liquidity conditions tightened following the Federal Reserve’s mid-June policy meeting. Led by newly appointed Chair Kevin Warsh, the Federal Open Market Committee held interest rates steady but delivered a distinctly hawkish message. Driven by an energy-fueled spike in consumer price inflation to 4.2%, nearly half of the committee flagged the potential for a rate hike later in the year. The central bank's sudden shift to strip out forward-looking guidance and downplay future rate cuts triggered a broad risk-off response across global markets, disproportionately impacting high-beta digital assets like Solana as Treasury yields hovered at elevated levels.
This macroeconomic friction coincided with a significant unwinding of institutional long exposure, which had previously served as a major tailwind for the token. Form 13F disclosures revealed that Goldman Sachs completely liquidated its entire spot Solana ETF holdings, divesting over one hundred million dollars in exposure. This abrupt exit severely damaged institutional market sentiment, prompting a shift in capital flows and triggering a string of net outflows from spot Solana exchange-traded funds. The loss of this institutional bidding block has left the spot market order book vulnerable, as buyers have largely retreated to wait for a clearer macro signal.
Compounding this demand deficit is a persistent supply overhang generated by both scheduled protocol mechanisms and large ecosystem participants. The market continues to absorb the impact of a substantial token unlock of more than six hundred thousand tokens, which entered circulating supply earlier in the month. Simultaneously, direct selling pressure intensified as the prominent memecoin launchpad Pump.fun offloaded over one hundred thousand tokens into the spot market to lock in capital, putting immediate downward pressure on prices.
From a technical and structural standpoint, the token remains trapped in a consolidated bearish trend. Having repeatedly failed to reclaim the crucial psychological resistance level near seventy-five dollars, the price has slipped back below its major short- and long-term exponential moving averages. Derivatives positioning indicates that market participants are increasingly reluctant to support the asset, with overall trading volume dropping substantially and open interest continuing to drift lower. The lack of momentum is reflected in a depressed Relative Strength Index, which indicates that while the asset is vulnerable to further downside, it has not yet reached extreme oversold levels that would trigger a meaningful technical rebound. In the near term, investors are closely monitoring whether the token can establish a firm support floor or if it will break lower toward previous range lows.
Technical Analysis of Solana (SOLUSD)
Technically, Solana (SOLUSD) shows a MACD (12,26,9) value of 2.279, indicating a neutral signal. The RSI at 44.810 suggests neutral condition and the Williams %R at 30.506 suggests buy condition. Please monitor closely.

More details about Solana (SOLUSD)
Recent Events and Risks:
- Bearish Technical Alignment and Resistance Rejections: SOLUSD remains locked in a strong downward trend, failing to sustain minor intraday rebounds past the $75 level and trading near $72. The token's price is pressed below its declining 20, 50, 100, and 200-day EMAs, with a daily RSI remaining under 50, which increases the likelihood of a deeper breakdown toward the early-June support floor near $58.
- Severe Contraction in On-Chain Activity and Fee Volumes: Solana's primary speculative driver is rapidly cooling. Weekly DEX trading volumes have collapsed nearly 80%, dropping from $5.2 billion to $1.1 billion, while daily network fees have plummeted from roughly 33,000 SOL to 5,300 SOL. This decline is compounded by a collapse in Pump.fun's token graduation rate to a mere 0.26%, signaling a sharp retail rotation away from the ecosystem.
- Institutional Capitulation and ETF Capital Outflows: Institutional market sentiment has deteriorated following disclosures that Goldman Sachs completely liquidated its entire $108 million Solana ETF and trust holdings. This complete high-profile exit coincides with spot Solana ETFs switching to net weekly outflows, removing key price support from the spot market's order books.
- Ongoing Supply Shocks and Treasury Selling: Persistent spot market selling continues to establish a local ceiling on the asset's price. A scheduled token unlock of 624,666 SOL has added fresh supply at a time of low demand, while aggressive treasury liquidation from major ecosystem platforms—such as Pump.fun offloading over 100,000 SOL (~$8.5 million)—exerts direct and compounding downward pressure.
Recommended Articles


