

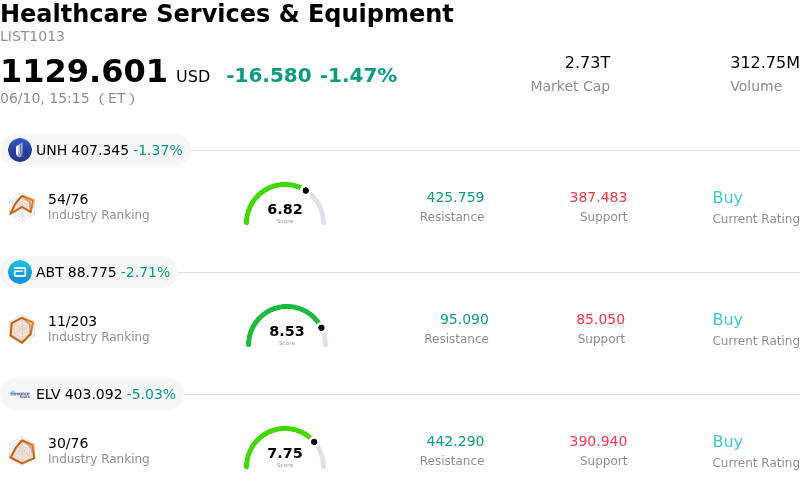
Elevance Health Inc Stock (ELV) Moved Down by 5.03% on Jun 10: Facts Behind the Movement
Elevance Health Inc (ELV) moved down by 5.03%. The Healthcare Services & Equipment sector is down by 1.47%. The company underperformed the industry. Top 3 stocks by turnover in the sector: Unitedhealth Group Inc (UNH) down 1.37%; Abbott Laboratories (ABT) down 2.71%; Elevance Health Inc (ELV) down 5.03%.
What is driving Elevance Health Inc (ELV)’s stock price down today?
Elevance Health (ELV) experienced a notable decline in its share price today, likely influenced by a combination of factors including broader market sentiment and ongoing investor considerations regarding company valuation and past regulatory challenges.
While the company reaffirmed its full-year 2026 earnings guidance and benefit expense ratio targets, aligning largely with analyst expectations, this positive company-specific financial news appears to have been overshadowed by other dynamics. Market news indicated that futures were sliding due to escalating geopolitical tensions and a strong focus on upcoming CPI data, suggesting a challenging broader market environment. In such conditions, some investors may become more risk-averse or engage in profit-taking, particularly in stocks perceived as fully valued.
Indeed, a recent analysis narrative suggests that Elevance Health may be considered overvalued, with its fair value potentially below its recent closing price. This perception could lead investors to question whether future growth is already adequately reflected in the stock price, contributing to selling pressure when the overall market faces headwinds. Furthermore, although recent updates indicated reprieves regarding potential CMS sanctions related to Medicare Advantage risk adjustment data, past regulatory scrutiny and ongoing legal investigations related to these issues earlier in the year may contribute to lingering investor caution. This historical context, combined with the current market mood and valuation assessments, likely contributed to the stock's significant intraday movement.
Technical Analysis of Elevance Health Inc (ELV)
Technically, Elevance Health Inc (ELV) shows a MACD (12,26,9) value of [13.29], indicating a buy signal. The RSI at 72.39 suggests buy condition and the Williams %R at -5.26 suggests oversold condition. Please monitor closely.
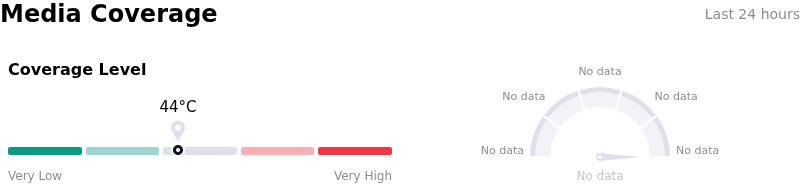
Media Coverage of Elevance Health Inc (ELV)
In terms of media coverage, Elevance Health Inc (ELV) shows a coverage score of 44, indicating a moderate level of media attention. The overall market sentiment index is currently in extremely bullish zone.
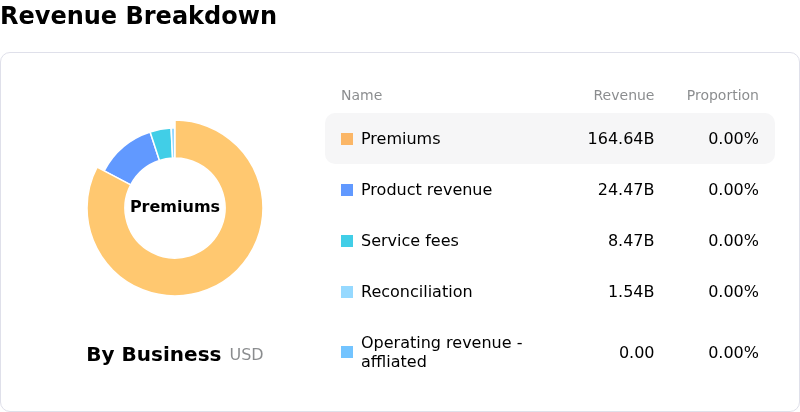
Fundamental Analysis of Elevance Health Inc (ELV)
Elevance Health Inc (ELV) is in the Healthcare Services & Equipment industry. Its latest annual revenue is $199.12B, ranking 4 in the industry. The net profit is $5.66B, ranking 4 in the industry. Company Profile
Over the past month, multiple analysts have rated the company as Buy, with an average price target of $414.52, a high of $498.00, and a low of $331.00.
More details about Elevance Health Inc (ELV)
Company Specific Risks:
- The company's reaffirmed full-year 2026 earnings guidance includes approximately $6.90 per diluted share of "net unfavorable items," indicating ongoing financial headwinds that may impact overall profitability.
- Elevance Health faces an ongoing regulatory overhang from the Centers for Medicare & Medicaid Services (CMS) review of its Medicare Advantage data and potential sanctions, which directly impacts government margins and rate negotiations.
- Analysts remain concerned about persistently elevated medical costs within the Medicaid and Affordable Care Act (ACA) plans, which could suppress profit margins despite the company's strategic diversification efforts.
- Significant exposure to government-sponsored programs like Medicaid and Medicare Advantage makes the company vulnerable to changes in government funding, regulatory policies, and compliance requirements.
Recommended Articles


