

Newmont Corporation Stock (NEM) Moved Down by 3.85% on May 19: Key Drivers Unveiled
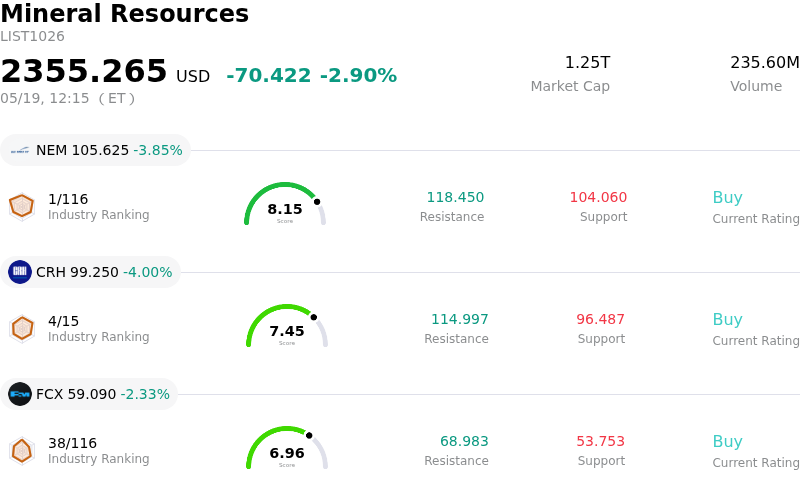
Newmont Corporation (NEM) moved down by 3.85%. The Mineral Resources sector is down by 2.90%. The company underperformed the industry. Top 3 stocks by turnover in the sector: Newmont Corporation (NEM) down 3.85%; CRH PLC (CRH) down 4.00%; Freeport-McMoRan Inc (FCX) down 2.33%.
What is driving Newmont Corporation (NEM)’s stock price down today?
Newmont's stock experienced a notable decline, influenced by a confluence of macroeconomic factors impacting the precious metals sector and specific company-related cost and operational concerns.
A significant contributor to the negative sentiment stems from the broader macroeconomic environment, particularly the market's expectation of sustained higher interest rates. This "higher-for-longer" outlook, fueled by inflation concerns and the anticipation of potential rate hikes rather than cuts by the Federal Reserve, tends to reduce the attractiveness of non-yielding assets like gold. Rising US Treasury yields and a stronger US dollar further weigh on gold prices, which in turn pressures the revenue and profitability of gold mining companies.
Adding to these external pressures are specific operational challenges and anticipated cost increases for Newmont. The company is facing projected higher all-in sustaining costs for 2026, driven by factors such as rising oil prices and a revised royalty structure in Ghana. Management has indicated that higher energy costs and the new royalty regime could lead to incremental cost headwinds, impacting future margins. Furthermore, ongoing unresolved governance and operational uncertainties surrounding the Nevada Gold Mines joint-venture also introduce an element of risk.
Despite Newmont reporting strong first-quarter 2026 results, including record free cash flow and a significant share repurchase authorization, investor focus appears to have shifted toward the more cautious outlook for 2026 operations. This includes a previously flagged expectation for lower gold output in the upcoming year and increased capital requirements. Recent institutional and insider selling activity, observed in prior periods, might also contribute to a cautious market stance, even though analyst ratings generally remain positive for the long term.
Technical Analysis of Newmont Corporation (NEM)
Technically, Newmont Corporation (NEM) shows a MACD (12,26,9) value of [0.57], indicating a neutral signal. The RSI at 45.23 suggests neutral condition and the Williams %R at -79.29 suggests oversold condition. Please monitor closely.
Fundamental Analysis of Newmont Corporation (NEM)
Newmont Corporation (NEM) is in the Mineral Resources industry. Its latest annual revenue is $22.67B, ranking 8 in the industry. The net profit is $7.08B, ranking 3 in the industry. Company Profile
Over the past month, multiple analysts have rated the company as Buy, with an average price target of $141.97, a high of $205.00, and a low of $64.32.
More details about Newmont Corporation (NEM)
Company Specific Risks:
- Newmont's revenue and cash flow are highly sensitive to retreating gold prices, which experienced a sharp decline on May 15, 2026, due to higher U.S. yields and a firmer dollar, potentially repricing near-term margins.
- Rising operational costs, driven by higher oil prices and Ghana's new royalty regime, are expected to maintain Newmont's All-in Sustaining Costs (AISC) above approximately $1,700 per ounce in 2026, consequently pressuring profit margins.
- Recent insider selling activity, including sales by David John Thornton on May 1, 2026, indicates a decrease in executive positions, which could be interpreted as a lack of confidence by company management.
Recommended Articles


