

Vertiv Holdings Co Stock (VRT) Moved Down by 9.01% on May 18: Key Drivers Unveiled
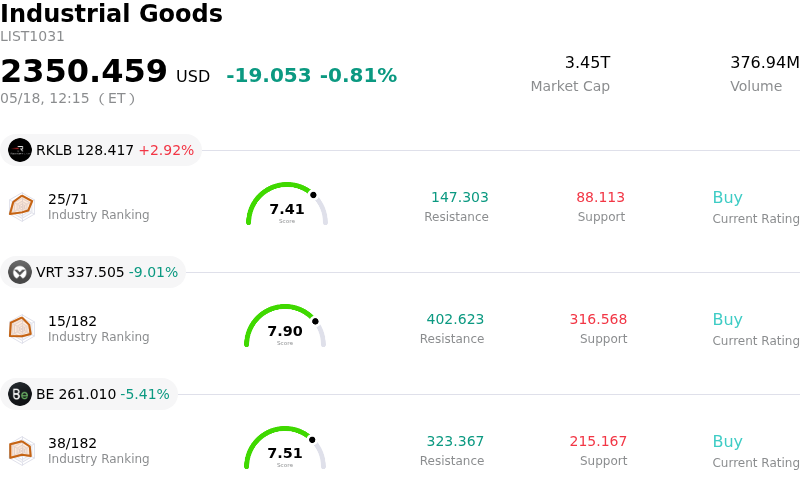
Vertiv Holdings Co (VRT) moved down by 9.01%. The Industrial Goods sector is down by 0.81%. The company underperformed the industry. Top 3 stocks by turnover in the sector: Rocket Lab USA Inc (RKLB) up 2.92%; Vertiv Holdings Co (VRT) down 9.01%; Bloom Energy Corp (BE) down 5.41%.
What is driving Vertiv Holdings Co (VRT)’s stock price down today?
Vertiv Holdings (VRT) experienced a significant intraday decline, likely influenced by a combination of factors including elevated valuation concerns, recent analyst adjustments, and ongoing insider selling activity. While the company reported strong first-quarter 2026 results in April, beating earnings and revenue estimates and raising its full-year guidance, its shares trade at a premium, leading some to suggest it is priced for perfection. This high valuation leaves the stock particularly susceptible to downward movements on any perceived shifts in sentiment or outlook.
A notable point of caution for investors has been the company's second-quarter 2026 earnings per share guidance, which, despite a strong overall financial outlook, came in slightly below consensus expectations when announced in April. Although full-year guidance was raised, a slight miss on near-term expectations can trigger significant market reactions, especially for stocks with high growth valuations. Furthermore, consistent insider selling has been observed, with a substantial number of shares disposed of by directors and insiders in the months leading up to May 2026. Such activity can be interpreted by the market as a lack of confidence from those most familiar with the company's prospects, contributing to selling pressure.
Earlier analyst adjustments also underscored these risks. For instance, in late March, one firm downgraded Vertiv from "Buy" to "Hold," citing concerns that Wall Street's long-term margin assumptions were overly optimistic and that the stock's premium valuation left little room for error. This analysis also highlighted potential pressure from a slowdown in hyperscaler capital expenditure growth in subsequent years and execution risks associated with the company's large order backlog. Although other analysts have maintained or raised their price targets on Vertiv in May, reinforcing its position as a beneficiary of AI data center demand, the underlying concerns about valuation and execution may periodically resurface, leading to periods of increased volatility.
Technical Analysis of Vertiv Holdings Co (VRT)
Technically, Vertiv Holdings Co (VRT) shows a MACD (12,26,9) value of [20.02], indicating a buy signal. The RSI at 68.87 suggests neutral condition and the Williams %R at -10.45 suggests oversold condition. Please monitor closely.
Fundamental Analysis of Vertiv Holdings Co (VRT)
Vertiv Holdings Co (VRT) is in the Industrial Goods industry. Its latest annual revenue is $10.23B, ranking 17 in the industry. The net profit is $1.33B, ranking 13 in the industry. Company Profile
Over the past month, multiple analysts have rated the company as Buy, with an average price target of $344.58, a high of $500.00, and a low of $112.00.
More details about Vertiv Holdings Co (VRT)
Company Specific Risks:
- Vertiv Holdings Co has received an unsolicited "mini-tender" offer from Tutanota LLC to acquire shares at potentially disadvantageous terms, which the company recommends shareholders reject, creating uncertainty for investors.
- The company's stock exhibits significant overvaluation, trading at a substantial premium to its intrinsic value and historical price-to-earnings ratios, indicating high susceptibility to market corrections if growth expectations are not met.
- Insiders have conducted substantial share sales totaling $123.4 million over the past three months, which may signal a lack of confidence from those within the company regarding its current valuation or future prospects.
- Rapid operational scaling, manufacturing expansion, and acquisition integration in a hyper-growth sector expose the company to heightened execution risks, where any perceived operational misstep could lead to significant market volatility given the stock's premium pricing for "spectacular" performance.
Recommended Articles


