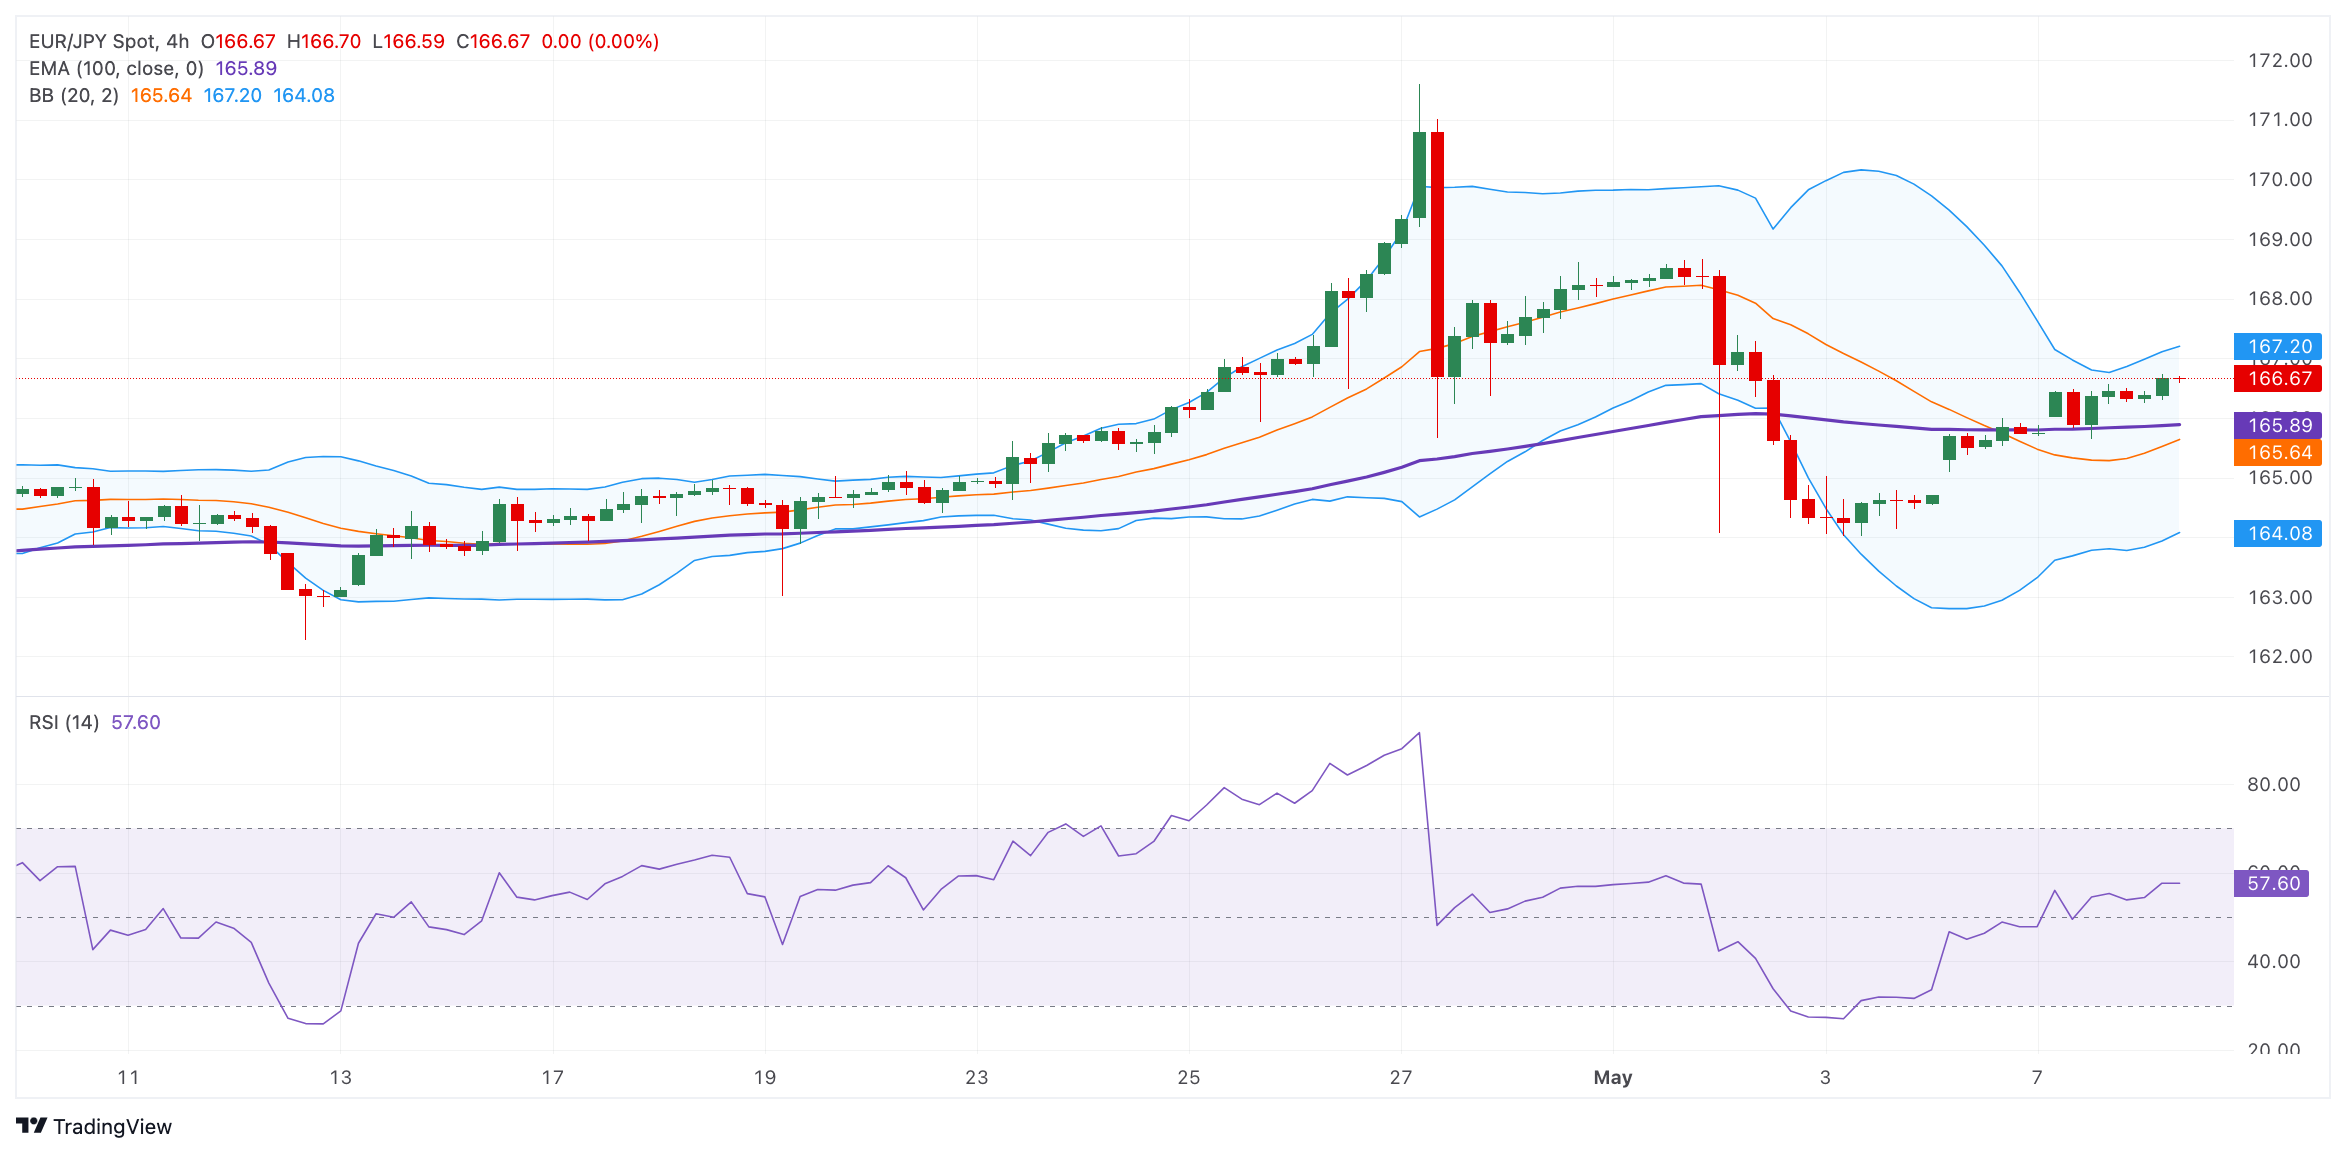
EUR/JPY Price Analysis: The first upside barrier will emerge at 167.20

FXStreet
Updated May 8, 2024 06:01
Mitrade

■  EUR/JPY gains traction near 166.65 in Wednesday's early European session.

■  The cross resumes its uptrend above the key EMA; RSI indicator holds in bullish territory. 

■  The first upside barrier will emerge at 167.20; the initial support level is located at 165.90.


The EUR/JPY cross trades on a positive note for three straight days around 166.65 on Wednesday during the early European session. The Bank of Japan (BoJ) Governor Kazuo Ueda said on Wednesday that the Japanese central bank may take monetary policy action if yen moves have a big impact on inflation. Meanwhile, Japanese Finance Minister Shunichi Suzuki stated that rapid foreign exchange movements are undesirable. Suzuki declined to comment on whether the US has agreed on Japan's FX intervention.

From a technical perspective, EUR/JPY resumes its uptrend as the cross holds above the key 100-period Exponential Moving Averages (EMA) on the four-hour chart. Additionally, the Relative Strength Index (RSI) stands in bullish territory around 58, indicating that further upside looks favorable for the time being. 

The upper boundary of the Bollinger Band at 167.20 acts as an immediate resistance level for the cross. Further north, the next hurdle is located at the 168.00 psychological figure, en route to a high of April 30 at 168.61. Any follow-through buying above the latter will see a rally to a yearly high of 2007 at 168.95. 

On the downside, the initial support level for EUR/JPY is seen near the 100-period EMA at 165.90. A decisive break below this level will see a drop to a low of May 6 at 165.50, followed by the lower limit of the Bollinger Band at 164.08.  


EUR/JPY four-hour chart


EUR/JPY


Overview
Today last price 166.7
Today Daily Change 0.33
Today Daily Change % 0.20
Today daily open 166.37
 
Trends
Daily SMA20 165.54
Daily SMA50 164.09
Daily SMA100 161.89
Daily SMA200 160.32
 
Levels
Previous Daily High 166.57
Previous Daily Low 165.64
Previous Weekly High 171.6
Previous Weekly Low 164.02
Previous Monthly High 171.6
Previous Monthly Low 162.28
Daily Fibonacci 38.2% 166.22
Daily Fibonacci 61.8% 166
Daily Pivot Point S1 165.82
Daily Pivot Point S2 165.26
Daily Pivot Point S3 164.89
Daily Pivot Point R1 166.75
Daily Pivot Point R2 167.12
Daily Pivot Point R3 167.68

* The content presented above, whether from a third party or not, is considered as general advice only.  This article should not be construed as containing investment advice, investment recommendations, an offer of or solicitation for any transactions in financial instruments.

Do you find this article useful?
Related Articles
placeholder
7 Powerful Forex Trading Strategies/Tips for Consistent ProfitsLearn the 7 powerful Forex trading strategies to improve your trading skills.
Author  Mitrade
Learn the 7 powerful Forex trading strategies to improve your trading skills.
placeholder
Forex Market Hours, Every Forex Trader Cannot MissKnowing what currency pairs to trade is vital in the forex market. Knowing when to trade is equally essential.
Author  Tony
Knowing what currency pairs to trade is vital in the forex market. Knowing when to trade is equally essential.
placeholder
Top 10 Must-Have Forex Technical Indicators That Every Trader Should UseYou can apply forex indicators to charts to visually represent market trends, patterns, and potential entry and exit points.
Author  Saqib Iqbal
You can apply forex indicators to charts to visually represent market trends, patterns, and potential entry and exit points.
placeholder
Hedging in Forex: How do Professionals Hedge?What is hedging exactly, and what is the right way to do it in Forex?
Author  Mitrade
What is hedging exactly, and what is the right way to do it in Forex?
placeholder
Japanese Yen Analysis & Forecast In 2024/2025/2026: Should I Buy USD/JPY Or Other JPY Currency Pairs?At the beginning of March 2022, the USD/JPY exchange rate sharply increased due to the Federal Reserve's interest rate hike policy aimed at curbing inflation, while the Bank of Japan continued to maintain negative interest rate policies to support the economy after the COVID-19 pandemic. By mid-October 2022, the USD/JPY exchange rate reached 151.94, the highest level since April 1990. Subsequently, the USD/JPY exchange rate started to decrease following reports suggesting that the Fed would ease off on interest rate hikes from December 2022, touching 127.5 by mid-January 2023.
Author  Mitrade
At the beginning of March 2022, the USD/JPY exchange rate sharply increased due to the Federal Reserve's interest rate hike policy aimed at curbing inflation, while the Bank of Japan continued to maintain negative interest rate policies to support the economy after the COVID-19 pandemic. By mid-October 2022, the USD/JPY exchange rate reached 151.94, the highest level since April 1990. Subsequently, the USD/JPY exchange rate started to decrease following reports suggesting that the Fed would ease off on interest rate hikes from December 2022, touching 127.5 by mid-January 2023.