Bitcoin Realized Losses Rival Luna Crash Levels as Market Absorbs $2 Billion Hit

coverImg
Source: DepositPhotos
  • Capitulation Signal: Net realized losses on the Bitcoin network surged to -$1.99 billion (7-day MA), echoing the systemic stress of the June 2022 Luna collapse.

  • Contextual Divergence: Unlike the 2022 crash which occurred near $19,000, current losses are realizing around $67,000, suggesting a washout of late-cycle leverage rather than structural failure.

  • Technical Edge: With $70,000 lost, price action has turned defensive, with bears eyeing the critical $60,000–$62,000 support zone for stability.

Bitcoin is navigating a precarious transition phase after surrendering the psychological $70,000 level, a breakdown that has forced the market into a defensive posture. As volatility spikes and liquidity conditions tighten, on-chain data reveals a capitulation event of historic proportions—though analysts argue the structural backdrop remains fundamentally distinct from previous bear market cycles.

A $2 Billion FlushAccording to analysis from on-chain analyst Axel Adler, the Bitcoin network is processing a wave of realized losses comparable to the darkest days of the 2022 bear market.

The Bitcoin Net Realized Profit/Loss 7-day moving average recently plummeted to approximately -$1.99 billion, signaling a massive flushing out of underwater positions. This magnitude of loss-taking mirrors the chaotic unraveling of the Terra/Luna ecosystem in June 2022.

Bitcoin Net Realized Profit/Loss | Source: CryptoQuant

Although the metric has seen a marginal recovery to roughly -$1.73 billion in subsequent sessions, it remains the second-deepest negative reading on record. The persistence of net losses below -$1.7 billion indicates sustained seller exhaustion, as late entrants who bought the top are forced to capitulate.

Same Pain, Different PriceWhile the gross dollar value of losses—climbing to approximately $2.3 billion on a 7-day basis—screens as alarming, the price context tells a different story.

Adler’s analysis highlights a critical divergence:

  • 2022 Context: The Luna-induced losses occurred when Bitcoin was trading near $19,000, signaling systemic failure and deep structural rot.

  • Current Context: Today’s losses are crystalizing around $67,000.

This distinction suggests the current move is a cyclical "cleanse" of late-bull market buyers and over-leveraged speculators rather than a fundamental network collapse. The market is effectively transferring coins from weak hands to stronger convictions at a significantly higher valuation floor.

Technical Structure: Bears in ControlDespite the constructive long-term view, the short-term technical picture remains bruised. Bitcoin’s decisive loss of $70,000 has shifted the immediate market structure, characterized by lower highs and accelerating selling pressure.

Price action is currently hovering in the mid-$60,000 range, weighing on sentiment. Crucially, Bitcoin is trading below key moving averages, which have flipped from support to formidable overhead resistance. The inability to reclaim these levels, accompanied by spikes in sell-side volume, reinforces the narrative of forced deleveraging rather than orderly rotation.
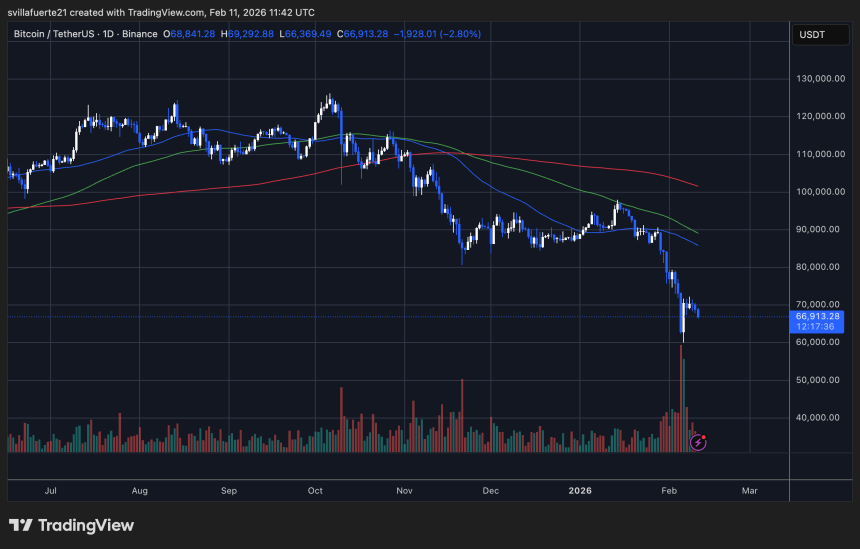
BTC testing critical demand level | Source: BTCUSDT chart on TradingView

The Line in the SandTraders are now focused on the $60,000–$62,000 region. This zone represents the next major liquidity cluster and aligns with historical consolidation patterns.

Holding this range is essential to stabilize sentiment and invite accumulation. However, a failure to defend this support could open the door to a deeper retracement, confirming that the "defensive phase" has more room to run.

Read more

  • Spot Gold Breaches Four Key Levels, Putting $3,500 at Risk as Technicals Enter Oversold Alert Zone
  • Note: If you want to share the article 《Bitcoin Realized Losses Rival Luna Crash Levels as Market Absorbs $2 Billion Hit》, make sure you retain the original link. For more information, please visit Insights or browse www.mitrade.com.

    The above content was completed with the assistance of AI and has been reviewed by an editor.


    goTop
    quote
    Related Articles
    placeholder
    Nvidia posts record $115.8B Q3 revenue, but crypto stays mutedThe crypto market remained subdued on Tuesday despite Nvidia's (NVDA) Q3 earnings release beating analysts' expectations as demand for artificial intelligence infrastructure continued to drive growth across its business.
    Author  FXStreet
    Nov 18, Wed
    The crypto market remained subdued on Tuesday despite Nvidia's (NVDA) Q3 earnings release beating analysts' expectations as demand for artificial intelligence infrastructure continued to drive growth across its business.
    placeholder
    Ethereum Drops Below $2,000 After Plunging Over 20% in a Month as Odds of $1,500 Retest SurgeEthereum Plunges Over 20% in a Month, Risking a Retest of $1,500 After Losing the $2,000 Defense Line.On November 13, Ethereum (ETH) plunged more than 5%, officially falling below the key
    Author  TradingKey
    Nov 13, Fri
    Ethereum Plunges Over 20% in a Month, Risking a Retest of $1,500 After Losing the $2,000 Defense Line.On November 13, Ethereum (ETH) plunged more than 5%, officially falling below the key
    placeholder
    Bitcoin lost its 200-day average — but the exit started three sessions before the CPIBitcoin fell 2.5% to about $73,400 on 11 November, an 11-week low, breaking its 200-day moving average near $73,100. The 24-hour liquidation tally reached $632 to $705 million, roughly 82% of it longs. But spot ETF outflows began three sessions earlier and USDT's market cap has shrunk $6.6 billion in 60 days — the leveraged length left before the inflation print did. A double top at 81,890 and 81,080 leaves a measured target of 69,366.
    Author  Suzie
    Nov 11, Wed
    Bitcoin fell 2.5% to about $73,400 on 11 November, an 11-week low, breaking its 200-day moving average near $73,100. The 24-hour liquidation tally reached $632 to $705 million, roughly 82% of it longs. But spot ETF outflows began three sessions earlier and USDT's market cap has shrunk $6.6 billion in 60 days — the leveraged length left before the inflation print did. A double top at 81,890 and 81,080 leaves a measured target of 69,366.
    placeholder
    Bitcoin Price Forecast: BTC faces pressure as weekly ETF outflows hit $1.28 billionBitcoin (BTC) remains under pressure on Monday, trading below the 50-week Simple Moving Average (SMA) at $75,222 after extending its losing streak to five consecutive weeks.
    Author  FXStreet
    Nov 09, Mon
    Bitcoin (BTC) remains under pressure on Monday, trading below the 50-week Simple Moving Average (SMA) at $75,222 after extending its losing streak to five consecutive weeks.
    placeholder
    Bitcoin ETFs sold $1.28 billion in a week — and BTC is still above 75,000US spot Bitcoin ETFs logged $1.28 billion of net outflows in the week to Nov 6, the largest since late June, with BlackRock's IBIT accounting for $1.21 billion. Yet BTC only fell from $80,405 to $74,940, a 6.8% move. The gap between the fund flow and the price is the story: leveraged longs were flushed, but spot holders did not follow the ETFs out — and $75,000 is the line that decides whether that reading holds.
    Author  Suzie
    Nov 09, Mon
    US spot Bitcoin ETFs logged $1.28 billion of net outflows in the week to Nov 6, the largest since late June, with BlackRock's IBIT accounting for $1.21 billion. Yet BTC only fell from $80,405 to $74,940, a 6.8% move. The gap between the fund flow and the price is the story: leveraged longs were flushed, but spot holders did not follow the ETFs out — and $75,000 is the line that decides whether that reading holds.
    Live Quotes
    Name / SymbolChart% Change / Price
    BTCUSD
    BTCUSD
    0.00%0.00

    cryptocurrency Related Articles

    • Top 3 Price Prediction: Bitcoin, Ethereum, Ripple — Bulls take the reins, with $100K BTC, $3,500 ETH and $2.35 XRP in focus
    • Best Strategies When BTC Price Drops: From Hedging to Accumulating
    • How to Day Trade Crypto? Simplest Day Trading Strategy Ever
    • Trading Chart Patterns:Ultimate Guide to Price Action
    • Places that Provide Cheapest Ways to Buy Bitcoin In 2025
    • 10 Best Crypto With Most Potential to Buy and invest in 2025 - Top Picks from Expert Traders

    Click to view more