Top Crypto Losers: BCH, HYPE, PUMP extend losses as Bitcoin drops below $64,000

Mitrade
coverImg
Source: DepositPhotos
  • Bitcoin Cash trades below $500 on Tuesday after a 13% fall on the previous day.

  • Hyperliquid extends its decline by 1% on Tuesday for the fourth consecutive day after Monday’s 9% drop.

  • Pump.fun drops below a crucial psychological support level following an 11% decline on Monday.

Altcoins, including Bitcoin Cash (BCH), Hyperliquid (HYPE), and Pump.fun (PUMP), are leading losses over the last 24 hours as Bitcoin falls below $64,000 on Tuesday. The technical outlook for BCH, HYPE, and PUMP flags downside risk amid broader market selling.

The broader cryptocurrency market remains under pressure as the US President Donald Trump seeks new legal tracks under national security concerns to impose new tariffs. Additionally, the US stock market closed Monday in the red. 

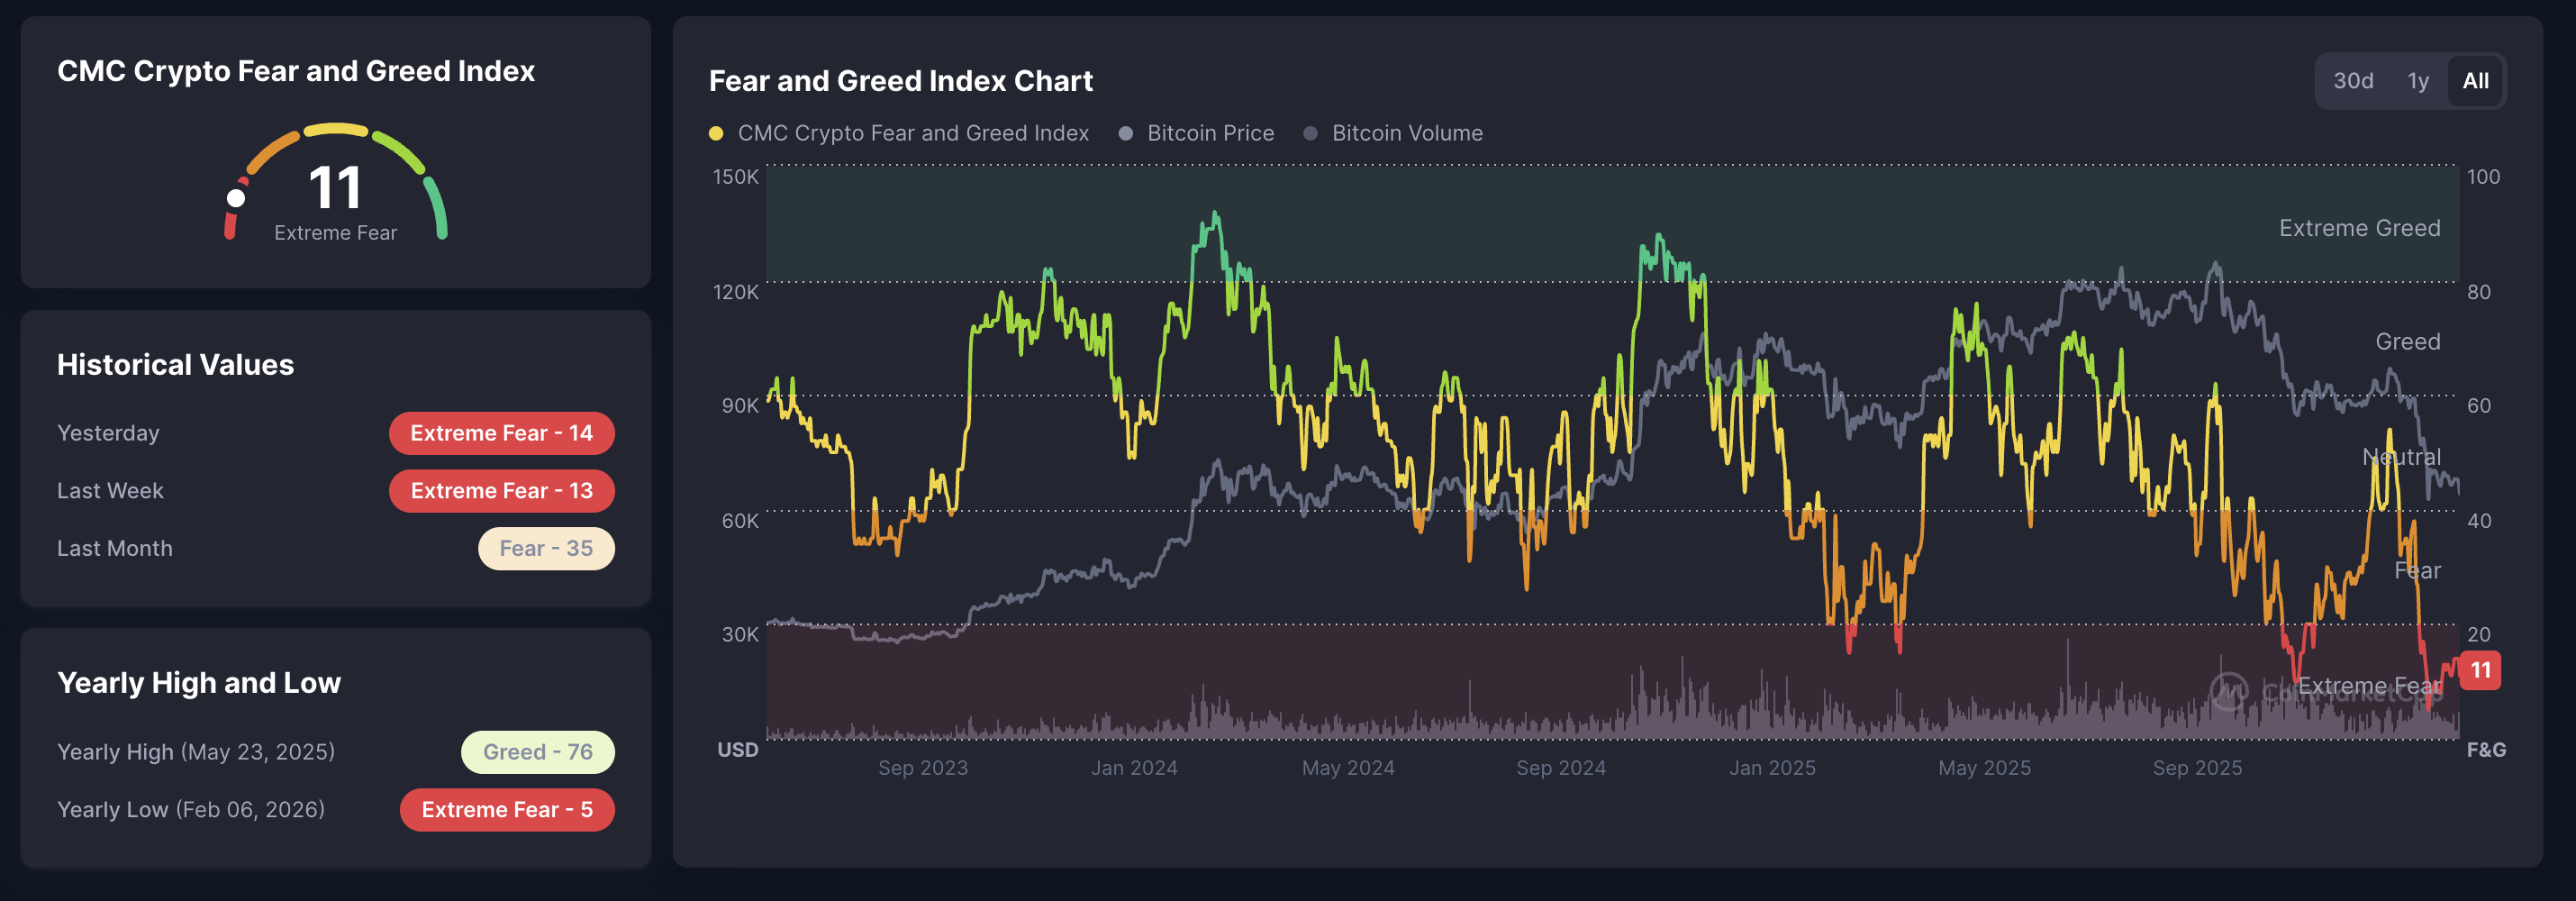
CoinMarketCap’s Fear and Greed Index at 11 flashes extreme fear in the market, reaffirming that sellers are dominant. 
Bitcoin Cash falls below $500

Bitcoin Cash is trading below $500 at the time of writing on Tuesday, following a 13% drop on the previous day. The altcoin is trading below its 200-day Exponential Moving Average (EMA) at $544, while the downward-sloping 50-day EMA is at $555, risking a potential death cross. 

The path of least resistance in BCH points to the $443 support level, which aligns with the October 17 low. 

The technical indicators of the daily chart suggest a bearish shift in trend momentum. The Relative Strength Index (RSI) is down to 36, closing toward the oversold region as selling pressure increases. At the same time, the Moving Average Convergence Divergence (MACD) crosses below its signal line, flashing a bearish crossover. 
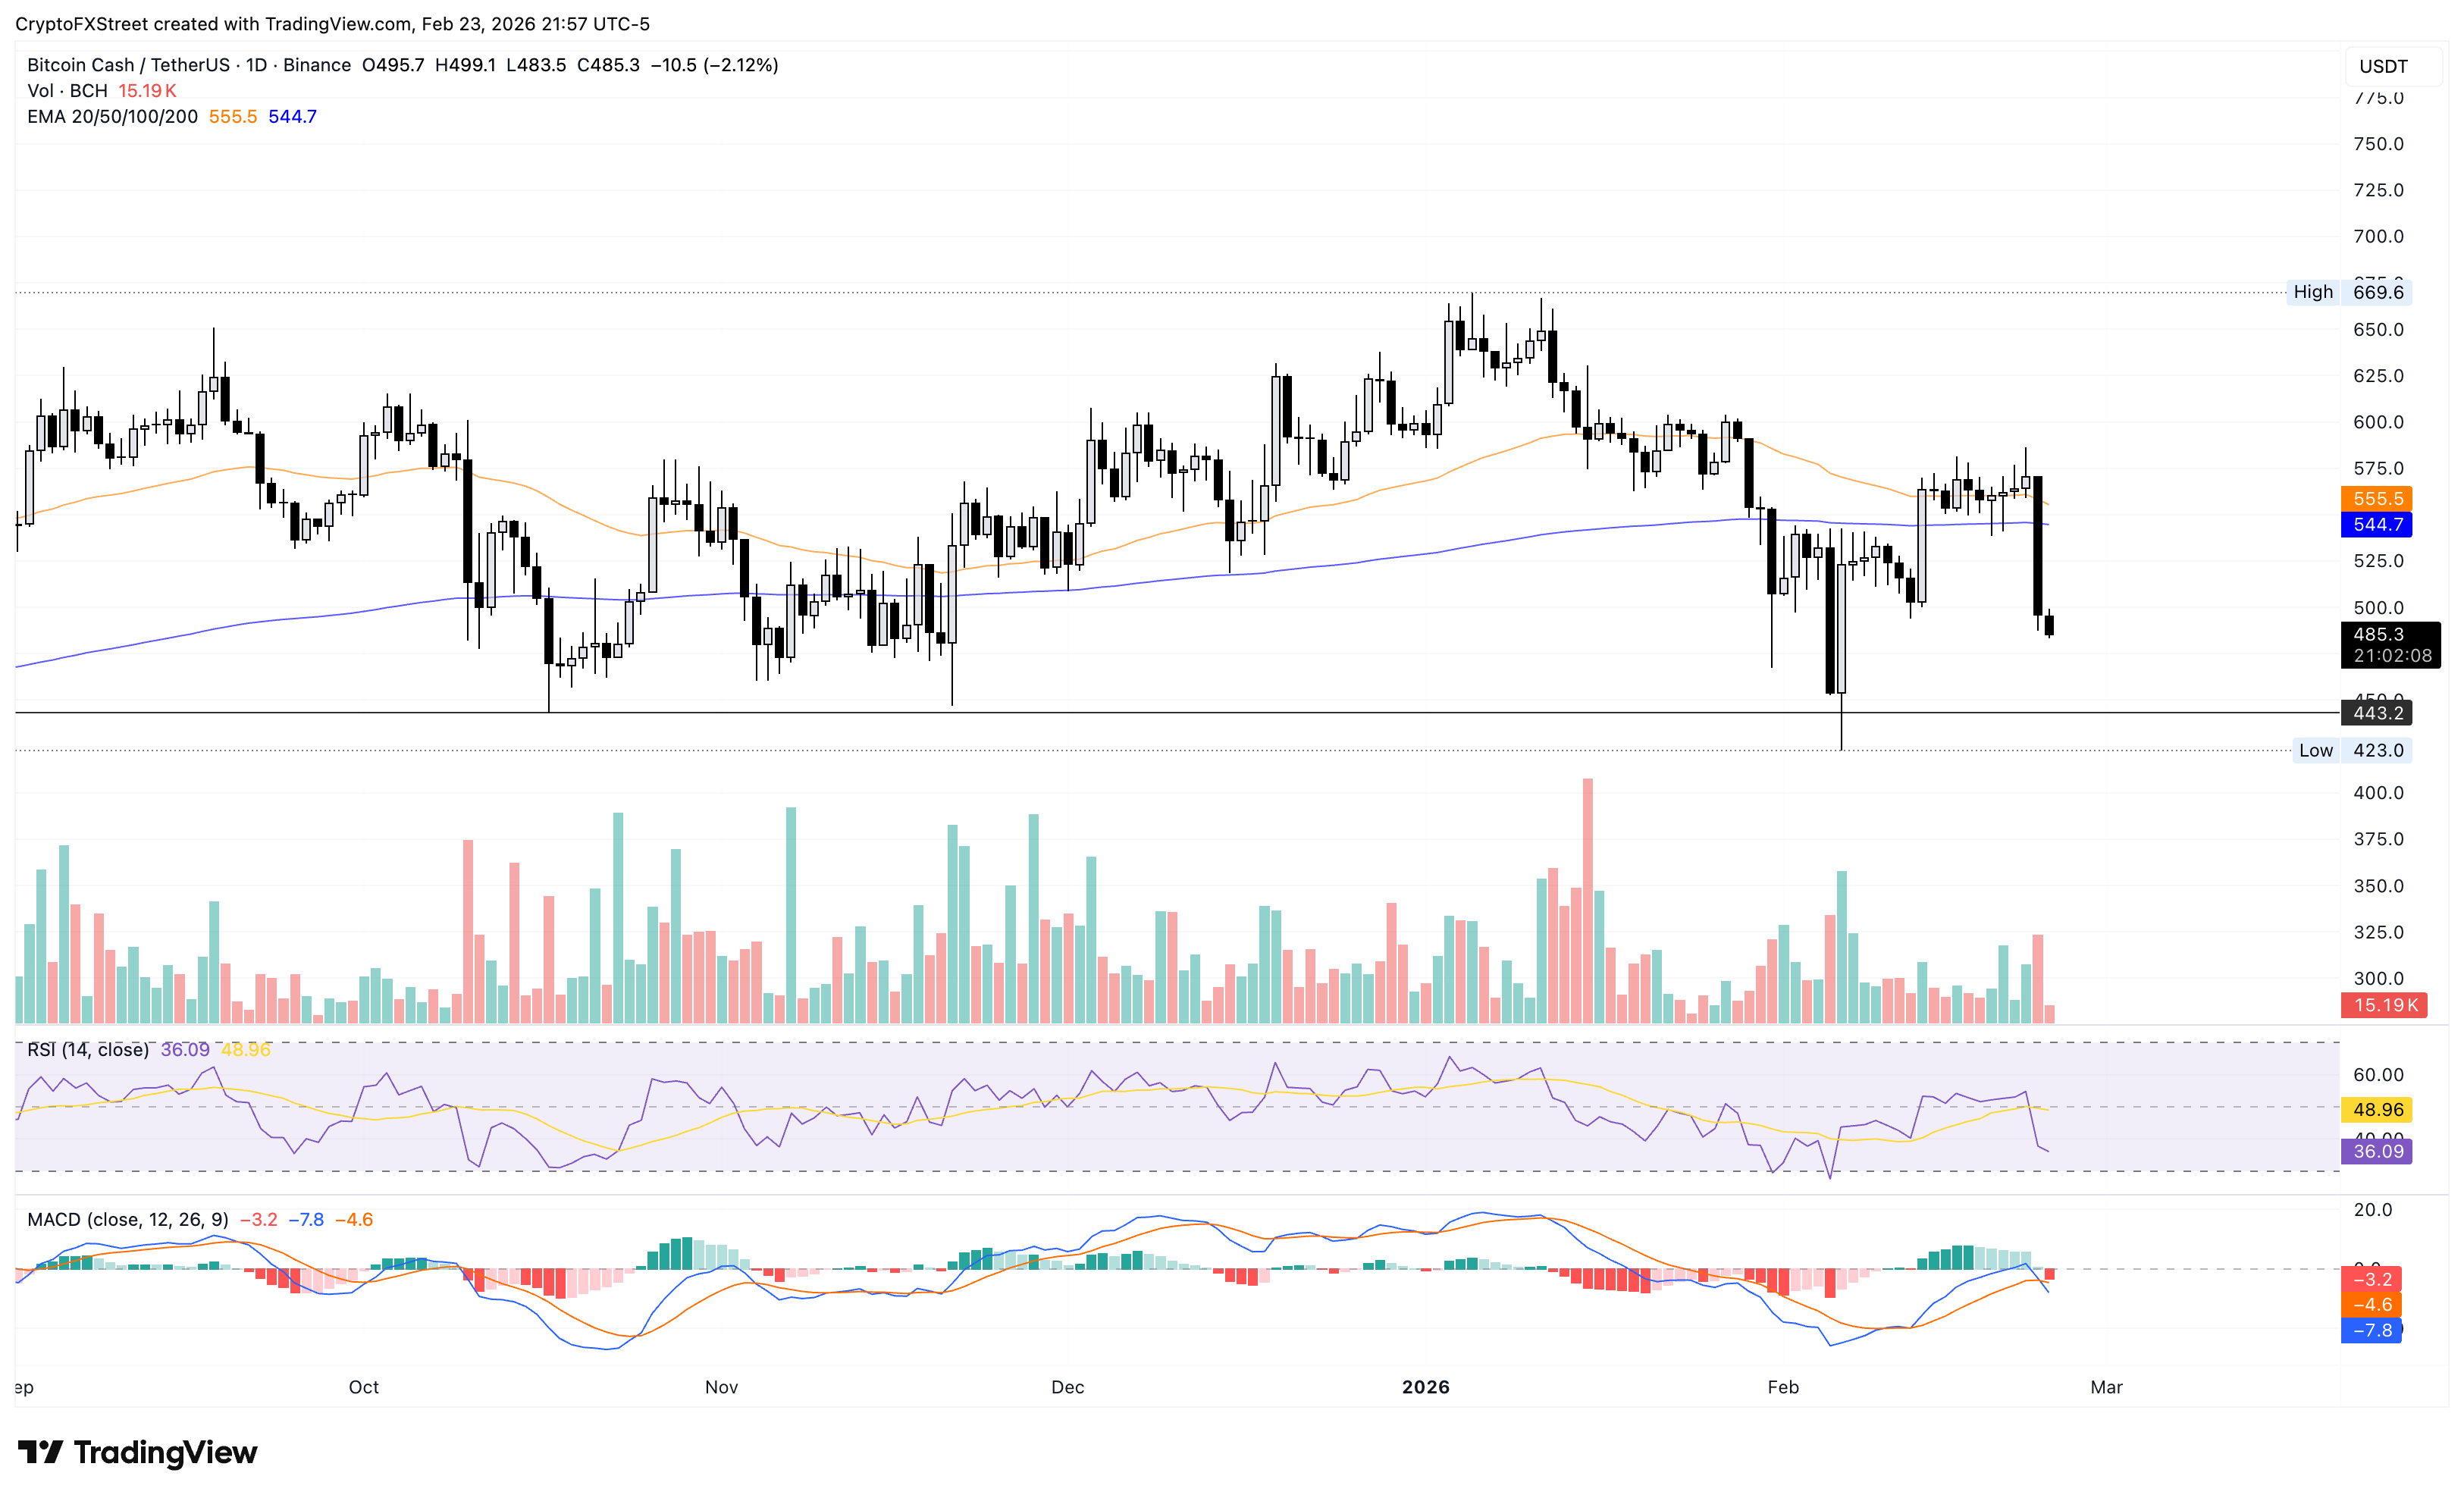
If Bitcoin Cash clears the $500 psychological level with a decisive daily close, it could ease downside pressure, lifting the recovery to the 200-day EMA at $544.

Hyperliquid loses ground as selling pressure intensifies

Hyperliquid is trading below $26 at the time of writing on Tuesday, extending the decline after a 9% drop on the previous day. The HYPE token declines for the fourth consecutive day, trades significantly below the 50-day EMA at $29.08 and the 200-day EMA at $32.37, reaffirming the bearish bias. 

The RSI is at 38 on the daily chart, extending the downward trend with further room before reaching the oversold region. The MACD and its signal line extend a steady decline as the bearish histograms widen. 

The immediate support levels for HYPE are the December 21 low at $23.58 and the October 10 low at $20.82. 
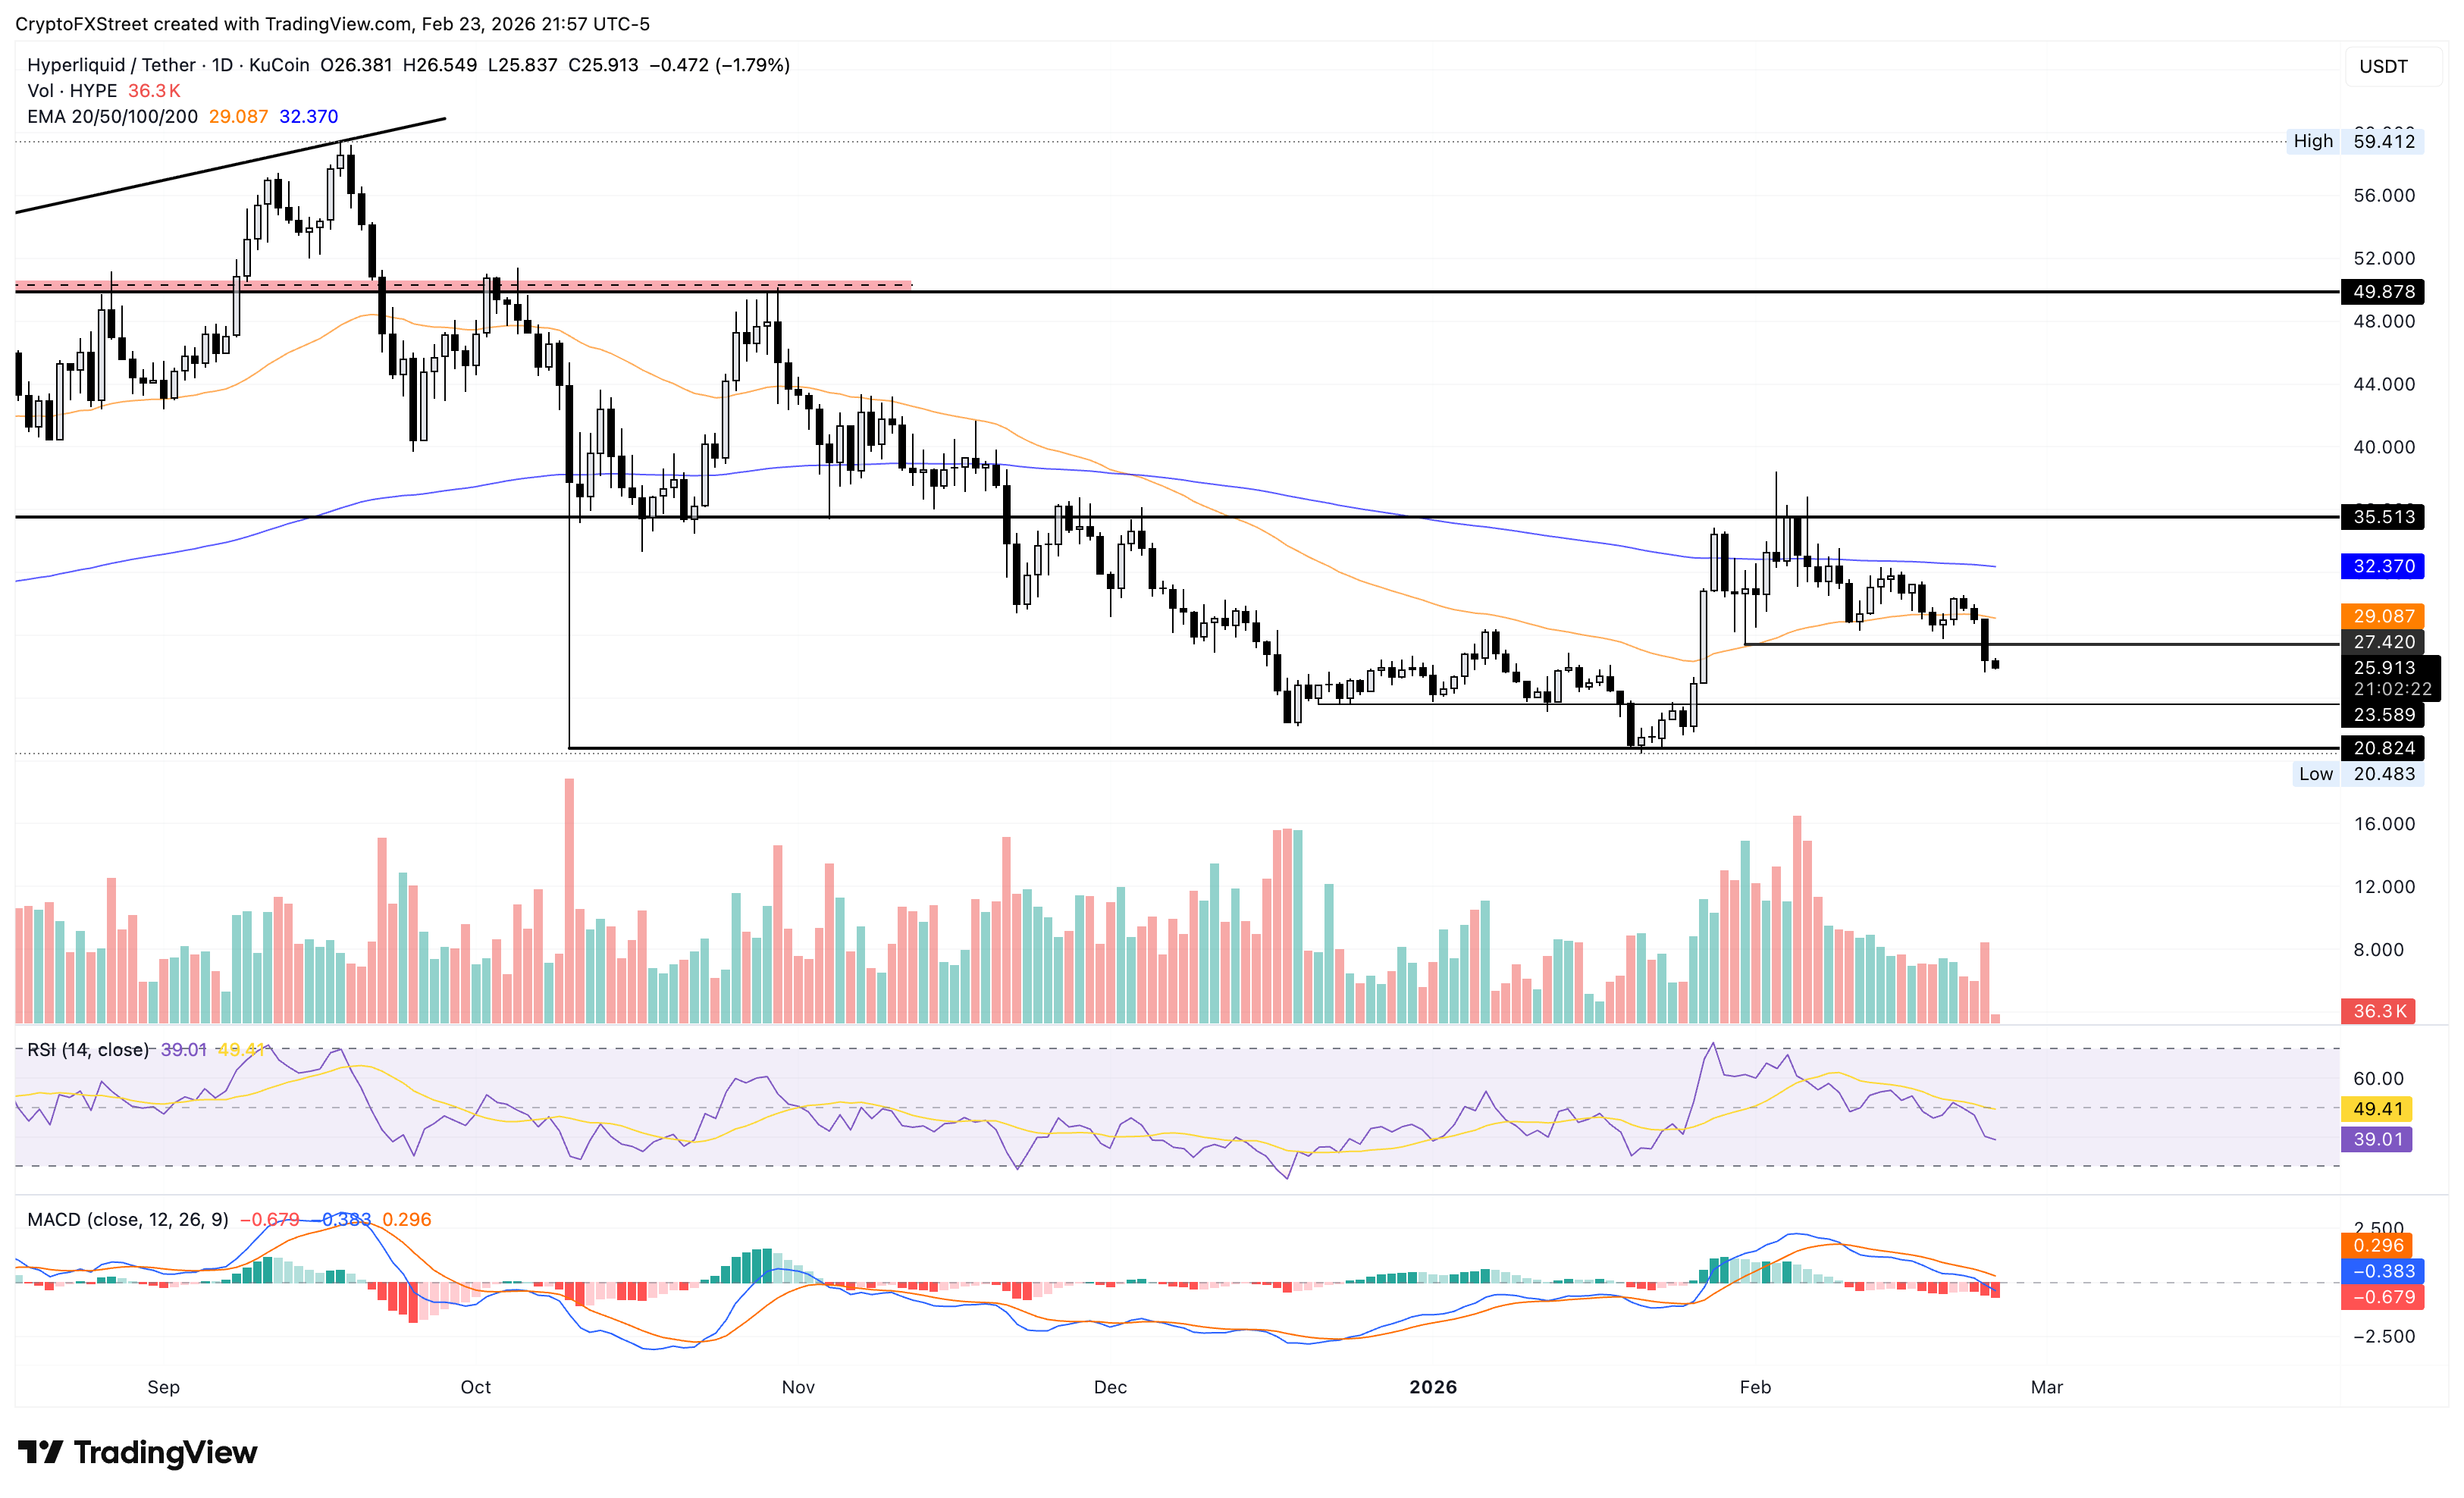
On the upside, Hyperliquid should reclaim the 50-day EMA at $29.08 to reinstate a short-term recovery.

Pump.fun under pressure flirts with all-time low

Pump.fun trades near $0.001800 at press time on Tuesday, following an 11% decline on Monday. The meme coin launchpad token has extended its broader decline since late September, targeting the $0.001678 support level, which previously helped trigger a rebound on February 6. 

A decisive close below this level could extend the decline to the S2 pivot point at $0.001199. 

The RSI at 37 hovers slightly above the oversold zone, suggesting increased selling pressure. Meanwhile, the MACD and signal line restart a declining trend after a crossover on Monday, suggesting renewed bearish momentum. 
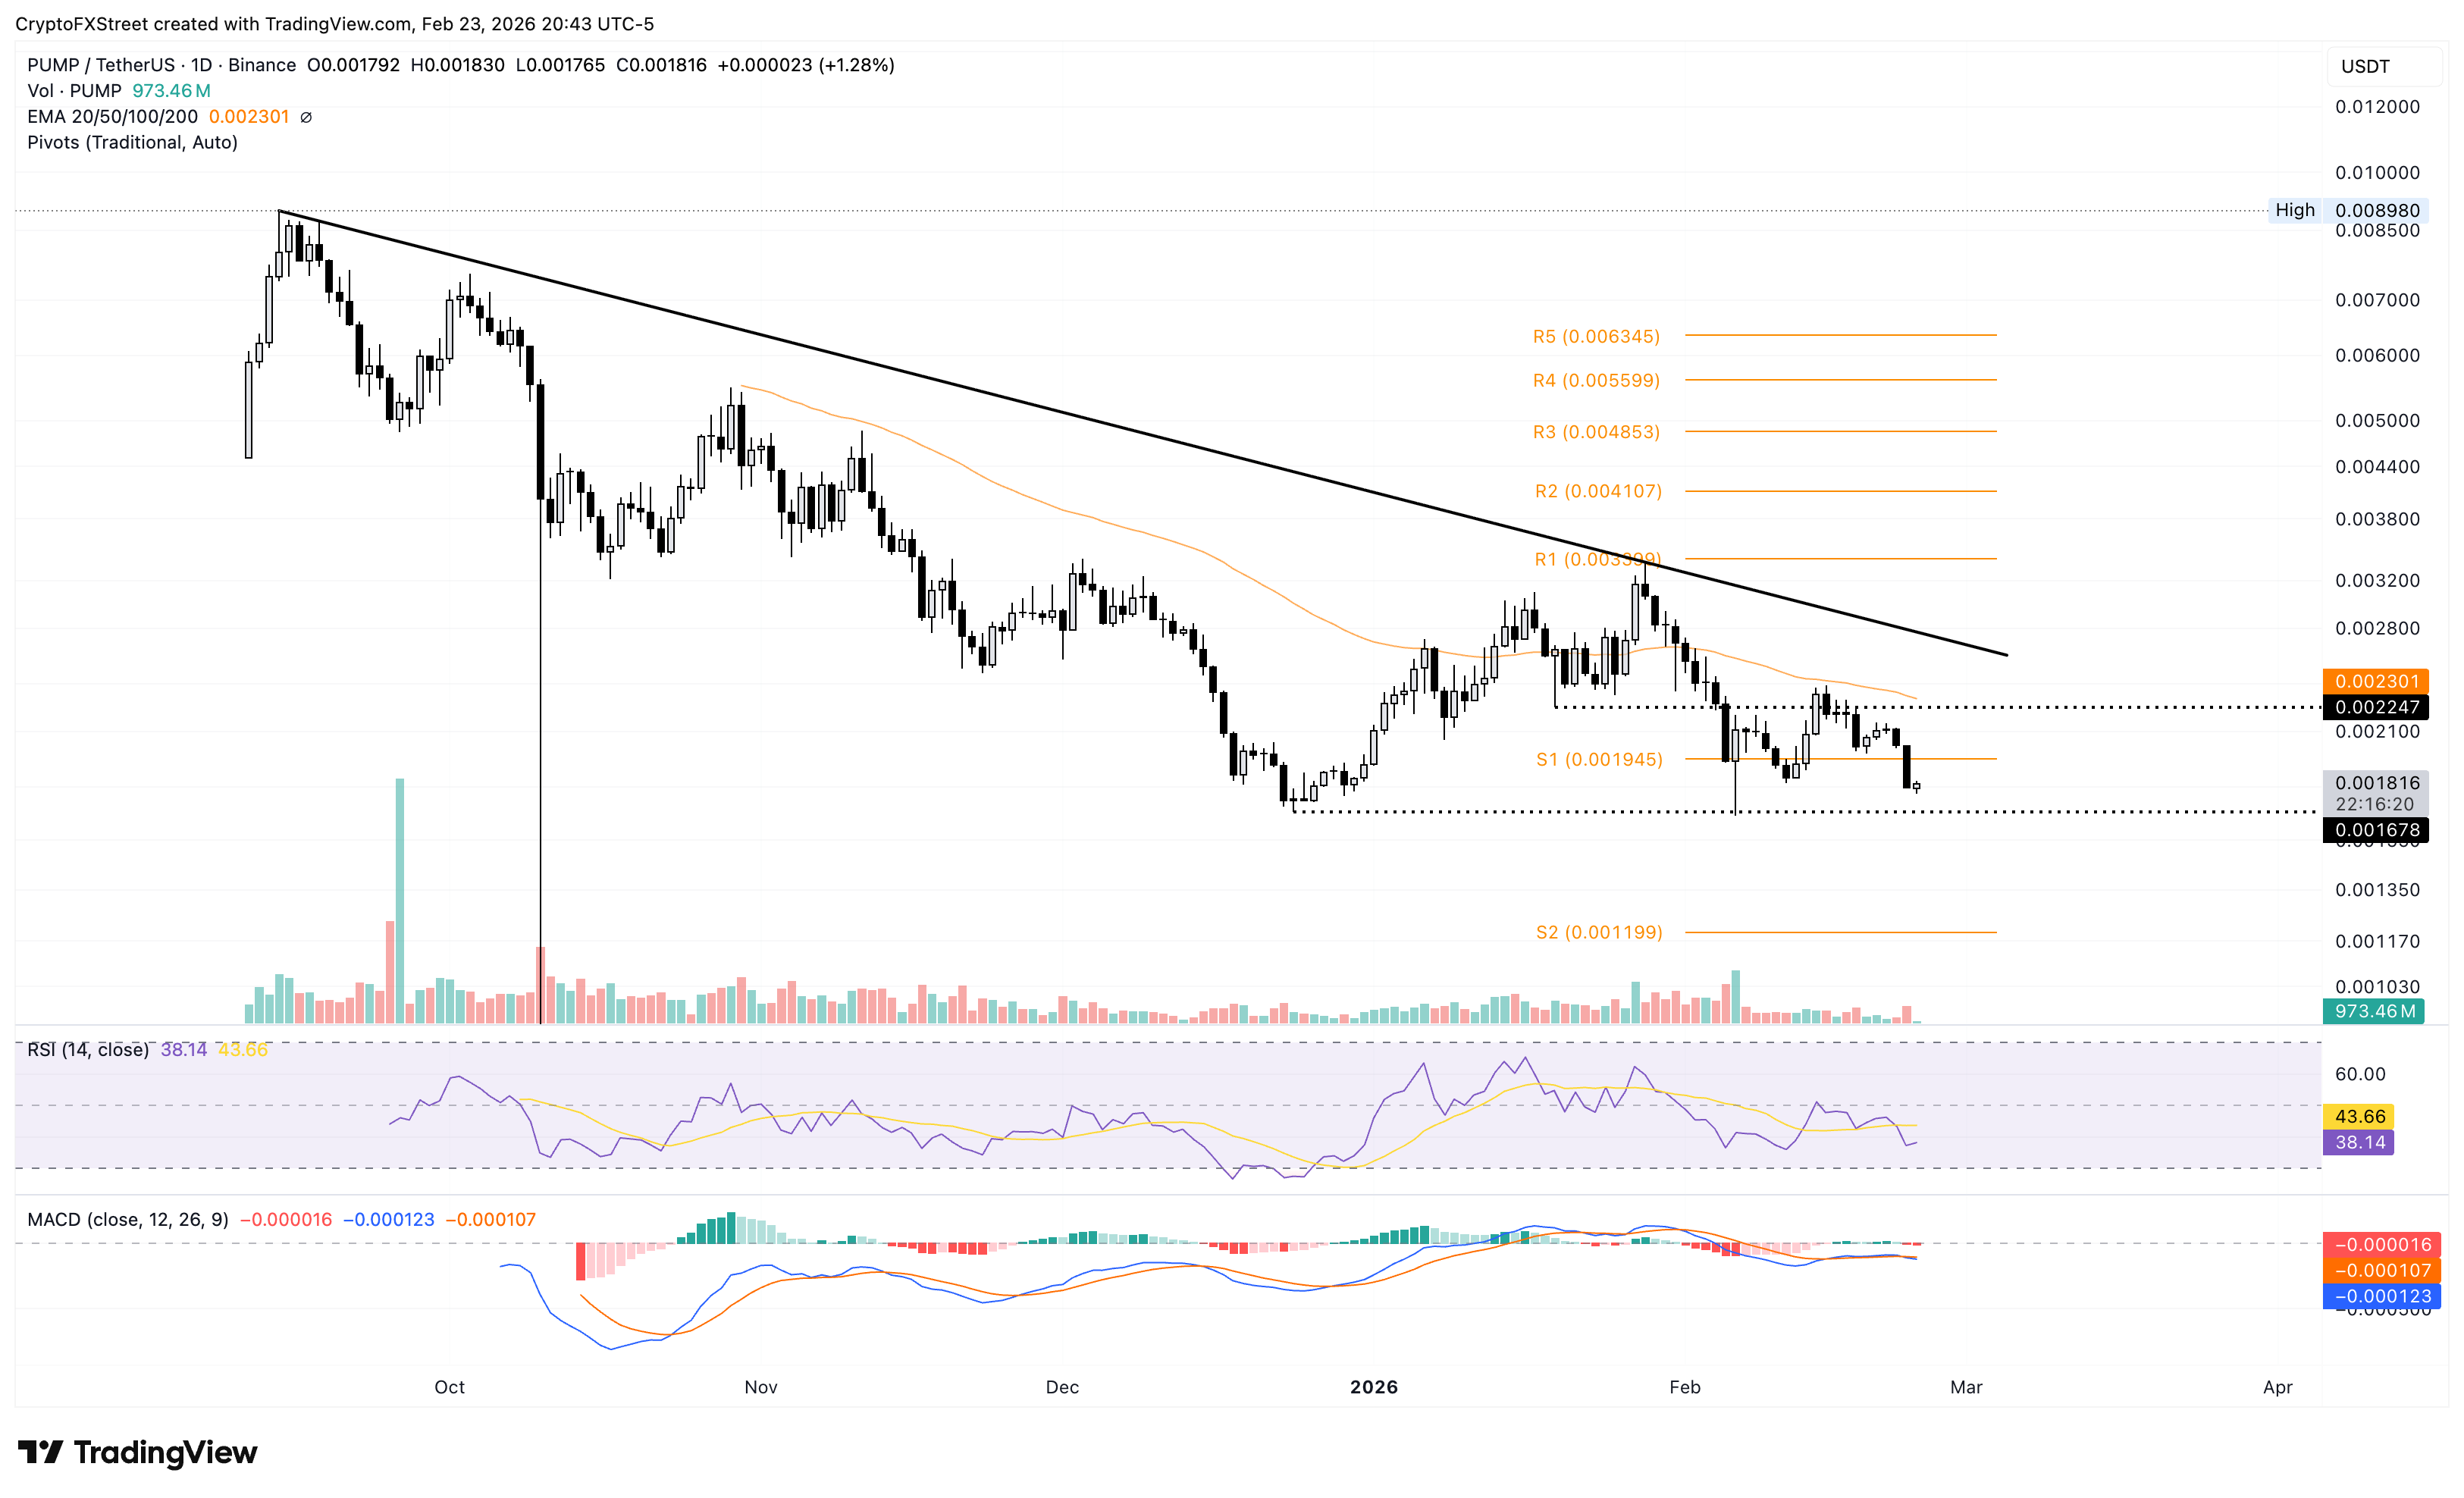
If PUMP reclaims the S1 pivot point at $0.001945, it could test the 50-day EMA at $0.002300.

Read more

  • Spot Gold Breaches Four Key Levels, Putting $3,500 at Risk as Technicals Enter Oversold Alert Zone
  • * The content presented above, whether from a third party or not, is considered as general advice only.  This article should not be construed as containing investment advice, investment recommendations, an offer of or solicitation for any transactions in financial instruments.

    goTop
    quote
    Related Articles
    placeholder
    Nvidia posts record $115.8B Q3 revenue, but crypto stays mutedThe crypto market remained subdued on Tuesday despite Nvidia's (NVDA) Q3 earnings release beating analysts' expectations as demand for artificial intelligence infrastructure continued to drive growth across its business.
    Author  FXStreet
    Nov 18, Wed
    The crypto market remained subdued on Tuesday despite Nvidia's (NVDA) Q3 earnings release beating analysts' expectations as demand for artificial intelligence infrastructure continued to drive growth across its business.
    placeholder
    Ethereum Drops Below $2,000 After Plunging Over 20% in a Month as Odds of $1,500 Retest SurgeEthereum Plunges Over 20% in a Month, Risking a Retest of $1,500 After Losing the $2,000 Defense Line.On November 13, Ethereum (ETH) plunged more than 5%, officially falling below the key
    Author  TradingKey
    Nov 13, Fri
    Ethereum Plunges Over 20% in a Month, Risking a Retest of $1,500 After Losing the $2,000 Defense Line.On November 13, Ethereum (ETH) plunged more than 5%, officially falling below the key
    placeholder
    Bitcoin lost its 200-day average — but the exit started three sessions before the CPIBitcoin fell 2.5% to about $73,400 on 11 November, an 11-week low, breaking its 200-day moving average near $73,100. The 24-hour liquidation tally reached $632 to $705 million, roughly 82% of it longs. But spot ETF outflows began three sessions earlier and USDT's market cap has shrunk $6.6 billion in 60 days — the leveraged length left before the inflation print did. A double top at 81,890 and 81,080 leaves a measured target of 69,366.
    Author  Suzie
    Nov 11, Wed
    Bitcoin fell 2.5% to about $73,400 on 11 November, an 11-week low, breaking its 200-day moving average near $73,100. The 24-hour liquidation tally reached $632 to $705 million, roughly 82% of it longs. But spot ETF outflows began three sessions earlier and USDT's market cap has shrunk $6.6 billion in 60 days — the leveraged length left before the inflation print did. A double top at 81,890 and 81,080 leaves a measured target of 69,366.
    placeholder
    Bitcoin Price Forecast: BTC faces pressure as weekly ETF outflows hit $1.28 billionBitcoin (BTC) remains under pressure on Monday, trading below the 50-week Simple Moving Average (SMA) at $75,222 after extending its losing streak to five consecutive weeks.
    Author  FXStreet
    Nov 09, Mon
    Bitcoin (BTC) remains under pressure on Monday, trading below the 50-week Simple Moving Average (SMA) at $75,222 after extending its losing streak to five consecutive weeks.
    placeholder
    Bitcoin ETFs sold $1.28 billion in a week — and BTC is still above 75,000US spot Bitcoin ETFs logged $1.28 billion of net outflows in the week to Nov 6, the largest since late June, with BlackRock's IBIT accounting for $1.21 billion. Yet BTC only fell from $80,405 to $74,940, a 6.8% move. The gap between the fund flow and the price is the story: leveraged longs were flushed, but spot holders did not follow the ETFs out — and $75,000 is the line that decides whether that reading holds.
    Author  Suzie
    Nov 09, Mon
    US spot Bitcoin ETFs logged $1.28 billion of net outflows in the week to Nov 6, the largest since late June, with BlackRock's IBIT accounting for $1.21 billion. Yet BTC only fell from $80,405 to $74,940, a 6.8% move. The gap between the fund flow and the price is the story: leveraged longs were flushed, but spot holders did not follow the ETFs out — and $75,000 is the line that decides whether that reading holds.
    Live Quotes
    Name / SymbolChart% Change / Price
    BTCUSD
    BTCUSD
    0.00%0.00
    ETHUSD
    ETHUSD
    0.00%0.00
    BCHUSD
    BCHUSD
    0.00%0.00

    cryptocurrency Related Articles

    • Top 3 Price Prediction: Bitcoin, Ethereum, Ripple — Bulls take the reins, with $100K BTC, $3,500 ETH and $2.35 XRP in focus
    • Best Strategies When BTC Price Drops: From Hedging to Accumulating
    • How to Day Trade Crypto? Simplest Day Trading Strategy Ever
    • Trading Chart Patterns:Ultimate Guide to Price Action
    • Places that Provide Cheapest Ways to Buy Bitcoin In 2025
    • 10 Best Crypto With Most Potential to Buy and invest in 2025 - Top Picks from Expert Traders

    Click to view more