Gold price collapses to two-week low amid robust US economic data

Mitrade
coverImg
Source: DepositPhotos

■  Gold prices fall 5% from July 17 peak of $2,483 to $2,364.

■  US Q2 GDP beats expectations, strengthening the US Dollar and impacting gold.

■  Market certainty grows for a Fed rate cut in September as Treasury yields decline.


Gold price tumbled to a two-week low on Thursday after the US Bureau of Economic Analysis reported that the economy in the United States (US) fared better than expected in the second quarter of 2024. This weighed on the precious metal, which lost over 1.30%, and XAU/USD trades at $2,364 at the time of writing.


Bullion prices hit their highest level on July 17, at $2,483; since then, they have fallen about 5% toward the current spot price. XAY/USD’s fall is mostly attributed to profit-taking as US Treasury yields also dropped while the Greenback remained firm.


US data revealed that the Gross Domestic Product in Q2 was better than expected, crushing the first-quarter numbers. Meanwhile, the number of Americans filing for unemployment benefits dipped compared to the week ending July 30. Durable Goods Orders contracted more than -6%, though excluding aircraft and transport, they recovered from May’s drop.


Despite all that, the US 10-year Treasury note coupon edged lower by more than four basis points (bps) and ended at 4.245% on Thursday. According to the CME FedWatch Tool data, investors seem 100% certain that the Federal Reserve will slash interest rates a quarter of a percentage point at the September meeting.


Daily digest market movers: Gold price on the backfoot as US GDP advances


US GDP for Q2 2024 jumped from 1.4% to 2.8% QoQ, exceeding forecasts of 2% on its advance reading.


US Initial Jobless Claims for the week ending July 20 rose by 235K, less than the estimated 238K and lower than the previous week's 245K.


US Durable Goods Orders plummeted by -6.6% MoM in June, significantly below the estimated 0.3%. However, Core Durable Goods, which excludes aircraft, expanded by 0.5% MoM, up from -0.1% and above the consensus projection of 0.2%.


The Fed’s preferred measure of inflation, the Core PCE, is expected to dip from 2.6% to 2.5% year-over-year (YoY).


Technical analysis: Gold price falls below $2,400 with sellers eyeing $2,300


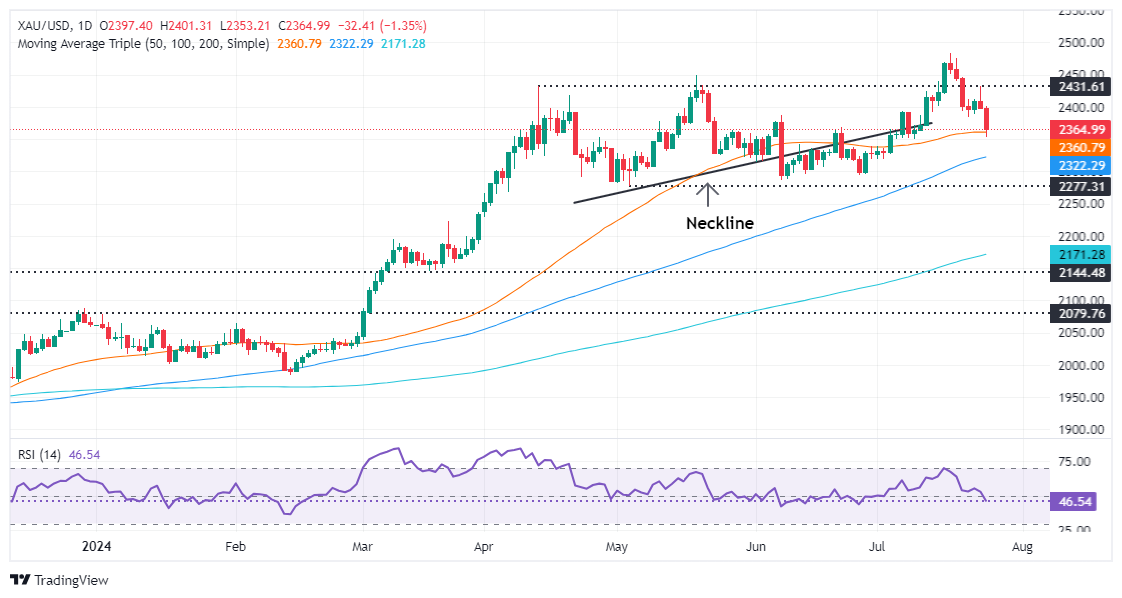
Bullion extended its losses once it achieved a daily close below $2,400 on Wednesday, which exacerbated a drop to familiar levels. Short-term momentum favors sellers, as portrayed by the Relative Strength Index (RSI), which just pierced the 50-neutral line.


Therefore, the XAU/USD might continue to edge lower. If sellers drag prices below the 50-day moving average (DMA) at $2,359, the next support would be the July 25 daily low of $2,353. Once those levels are removed, the 100-DMA would be up next at $2,324, ahead of diving to the $2,300 mark.


Conversely, buyers need to clear the $2,400 figure to test the all-time high (ATH) at around $2,483.
Read more

  • Gold Price Forecast: PPI and Oil Prices Fuel Inflation Concerns, Can CPI Change Gold's Direction?
  • * The content presented above, whether from a third party or not, is considered as general advice only.  This article should not be construed as containing investment advice, investment recommendations, an offer of or solicitation for any transactions in financial instruments.

    goTop
    quote
    Related Articles
    placeholder
    Gold Price Forecast: PPI and Oil Prices Fuel Inflation Concerns, Can CPI Change Gold's Direction?As of the Asian session on September 11, gold prices (XAUUSD) remained in weak consolidation today after dropping sharply to near $4,300 on Thursday, with the latest price trading around
    Author  TradingKey
    17 hours ago
    As of the Asian session on September 11, gold prices (XAUUSD) remained in weak consolidation today after dropping sharply to near $4,300 on Thursday, with the latest price trading around
    placeholder
    US August CPI lands tonight: after a 5.4% PPI shock, will the Fed hike on September 16?US August PPI came in at 5.4% year-on-year, above the 5.3% consensus, with core PPI at 4.6%. Traders have pushed the odds of a 25bp Fed hike on September 15-16 to around 70%. Tonight's CPI is the last major inflation print before the decision — here is the full calendar, the consensus numbers, and what a hot versus cool reading would mean for the dollar, yields, gold and stocks.
    Author  Irene Q.
    20 hours ago
    US August PPI came in at 5.4% year-on-year, above the 5.3% consensus, with core PPI at 4.6%. Traders have pushed the odds of a 25bp Fed hike on September 15-16 to around 70%. Tonight's CPI is the last major inflation print before the decision — here is the full calendar, the consensus numbers, and what a hot versus cool reading would mean for the dollar, yields, gold and stocks.
    placeholder
    TradingKey Daily Market Briefing: WTI Oil Tops $100, US Stocks Fall for 4th Day, Apple Bucks Trend, CPI AheadTracking Market TrendsTradingKey - On September 10 Eastern Time, the three major US stock indices fell for the fourth consecutive trading day. US August PPI showed upstream price pressures continued t
    Author  TradingKey
    Yesterday 01: 24
    Tracking Market TrendsTradingKey - On September 10 Eastern Time, the three major US stock indices fell for the fourth consecutive trading day. US August PPI showed upstream price pressures continued t
    placeholder
    US August CPI Preview: Will Inflation Reaccelerate? US Stocks, Dollar and Gold Face Key Test On Friday, September 11 (ET), the U.S. Bureau of Labor Statistics will release the Consumer Price Index (CPI) for August, the final major inflation report before the Federal Reserve's Sep
    Author  TradingKey
    Sep 10, Thu
    On Friday, September 11 (ET), the U.S. Bureau of Labor Statistics will release the Consumer Price Index (CPI) for August, the final major inflation report before the Federal Reserve's Sep
    placeholder
    US August PPI Preview: Producer Inflation May Reaccelerate, How Will US Stocks, Dollar, and Gold React?The U.S. Bureau of Labor Statistics will release the August Producer Price Index (PPI) at 8:30 a.m. ET on September 10. Against the backdrop of U.S. August non-farm payrolls significantly
    Author  TradingKey
    Sep 09, Wed
    The U.S. Bureau of Labor Statistics will release the August Producer Price Index (PPI) at 8:30 a.m. ET on September 10. Against the backdrop of U.S. August non-farm payrolls significantly
    Live Quotes
    Name / SymbolChart% Change / Price
    XAUUSD
    XAUUSD
    0.00%0.00
    USDOLLAR-F
    USDOLLAR-F
    0.00%0.00

    Gold Related Articles

    • 10 Best Day Trading Platforms for Beginners and Active Traders in 2026: A Practical Guide
    • What is Gold CFD? How to Trade Gold CFD With Mitrade Example
    • ​5 Best Paper Trading Platforms for 2026 (Free Demo Accounts for Beginners & Traders)
    • XAU/USD Gold Price Trend Analysis 2026: Will It Keep Rising?
    • Is Mitrade Right for You? A Complete Guide on How to Start Trading CFDs in 5 Steps
    • How and Where to Buy Gold in Australia? A Complete Guide for Beginners

    Click to view more