

Solana Price Forecast: Bearish grip tightens on SOL amid broader market sell-off

Source Fxstreet
  • Solana extends losses below $80 on Friday, continuing a corrective phase over the last six weeks, down 35%.
  • A broader market correction, with over $1 billion in total liquidations over the last 24 hours, weighs on SOL.
  • Derivatives data points to a sell-side dominance with heavy outflows and a declining taker buy-to-sell ratio.

Solana (SOL) is down 4% on Friday, extending losses below $80 and marking a nearly 10% decline so far this week. The broader cryptocurrency market is seeing heavy selling, with Bitcoin (BTC) diving below $70,000 and wiping out more than $1 billion in the derivatives market. This adds to the sell-side dominance in SOL futures amid persistent outflows. The technical outlook for SOL is bearish as downside momentum remains firm despite the asset entering oversold territory.

Crypto market liquidations cross $1 billion in 24 hours

Bitcoin’s slip below $70,000 on Friday mirrors Nvidia's decline, as CEO Jensen Huang resigns amid public and board scrutiny over personal relationships. CoinGlass data shows that the pullback wiped out $1.41 billion over the last 24 hours, with $1.26 billion in longs, reflecting a clear selling bias. 
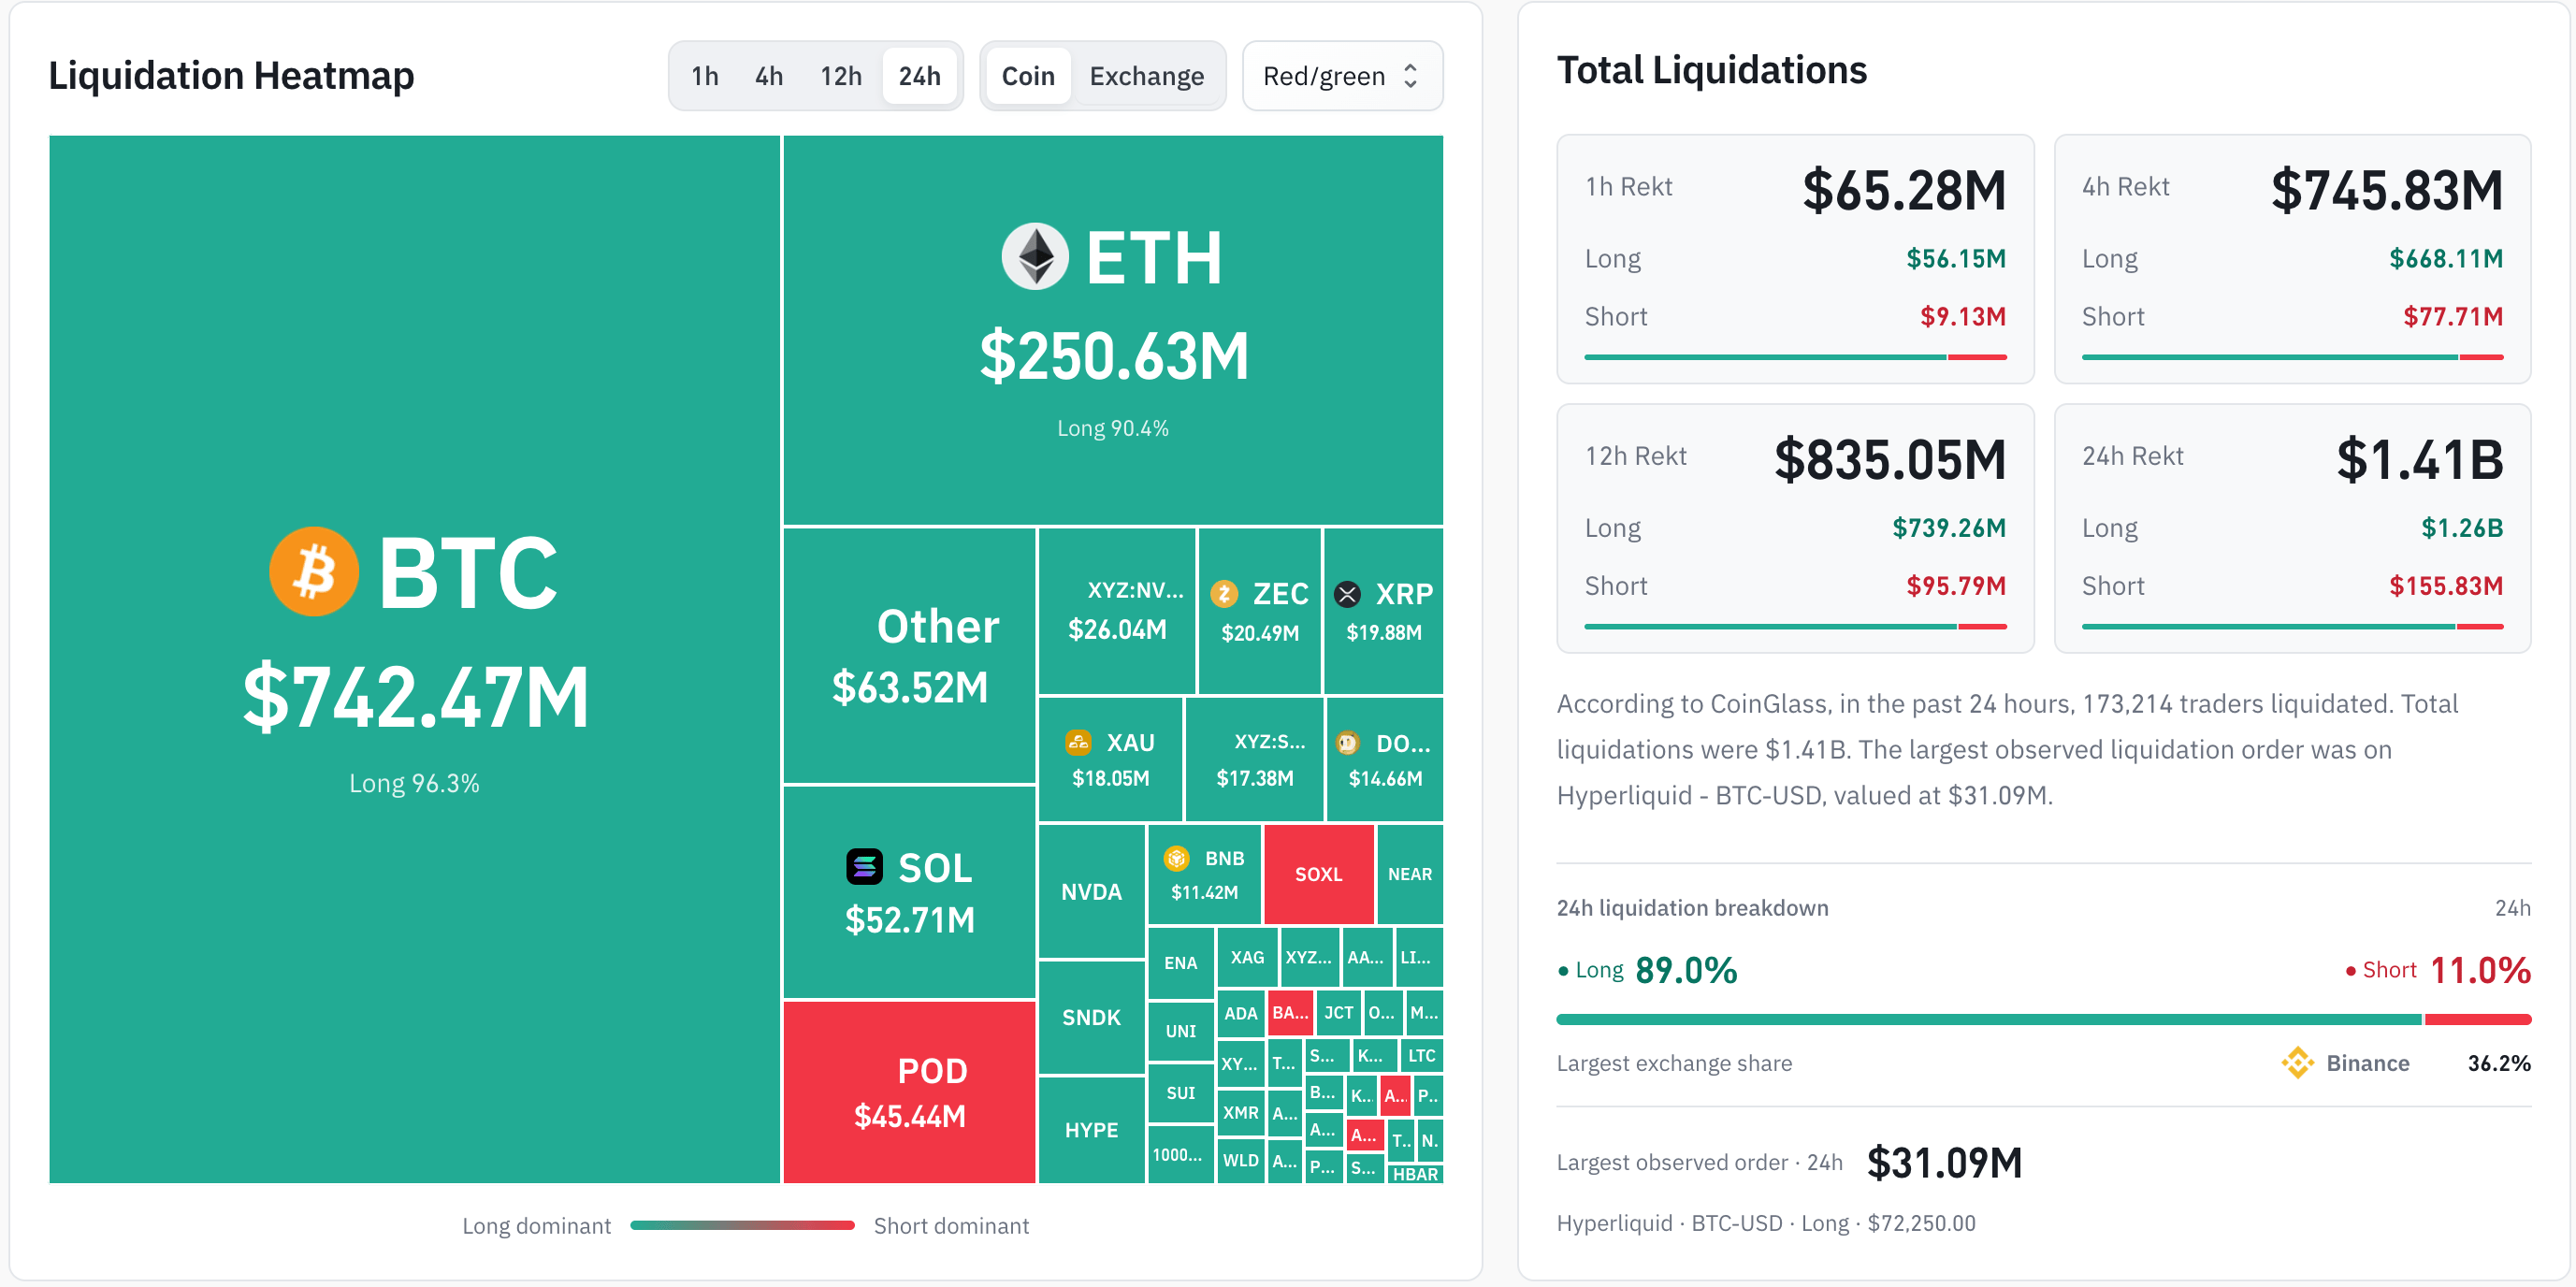
Crypto liquidation data. Source: CoinGlass

In the case of Solana, futures have seen $191 million in outflows so far on Friday, while spot market outflows have reached $8.80 million. In addition, the SOL taker buy-to-sell ratio around 0.90 has remained below 1 since late July, indicating a firm bearish bias among traders.

Taken together, the risk-off sentiment in the derivatives market strengthens amid uncertain broader market and macroeconomic conditions.
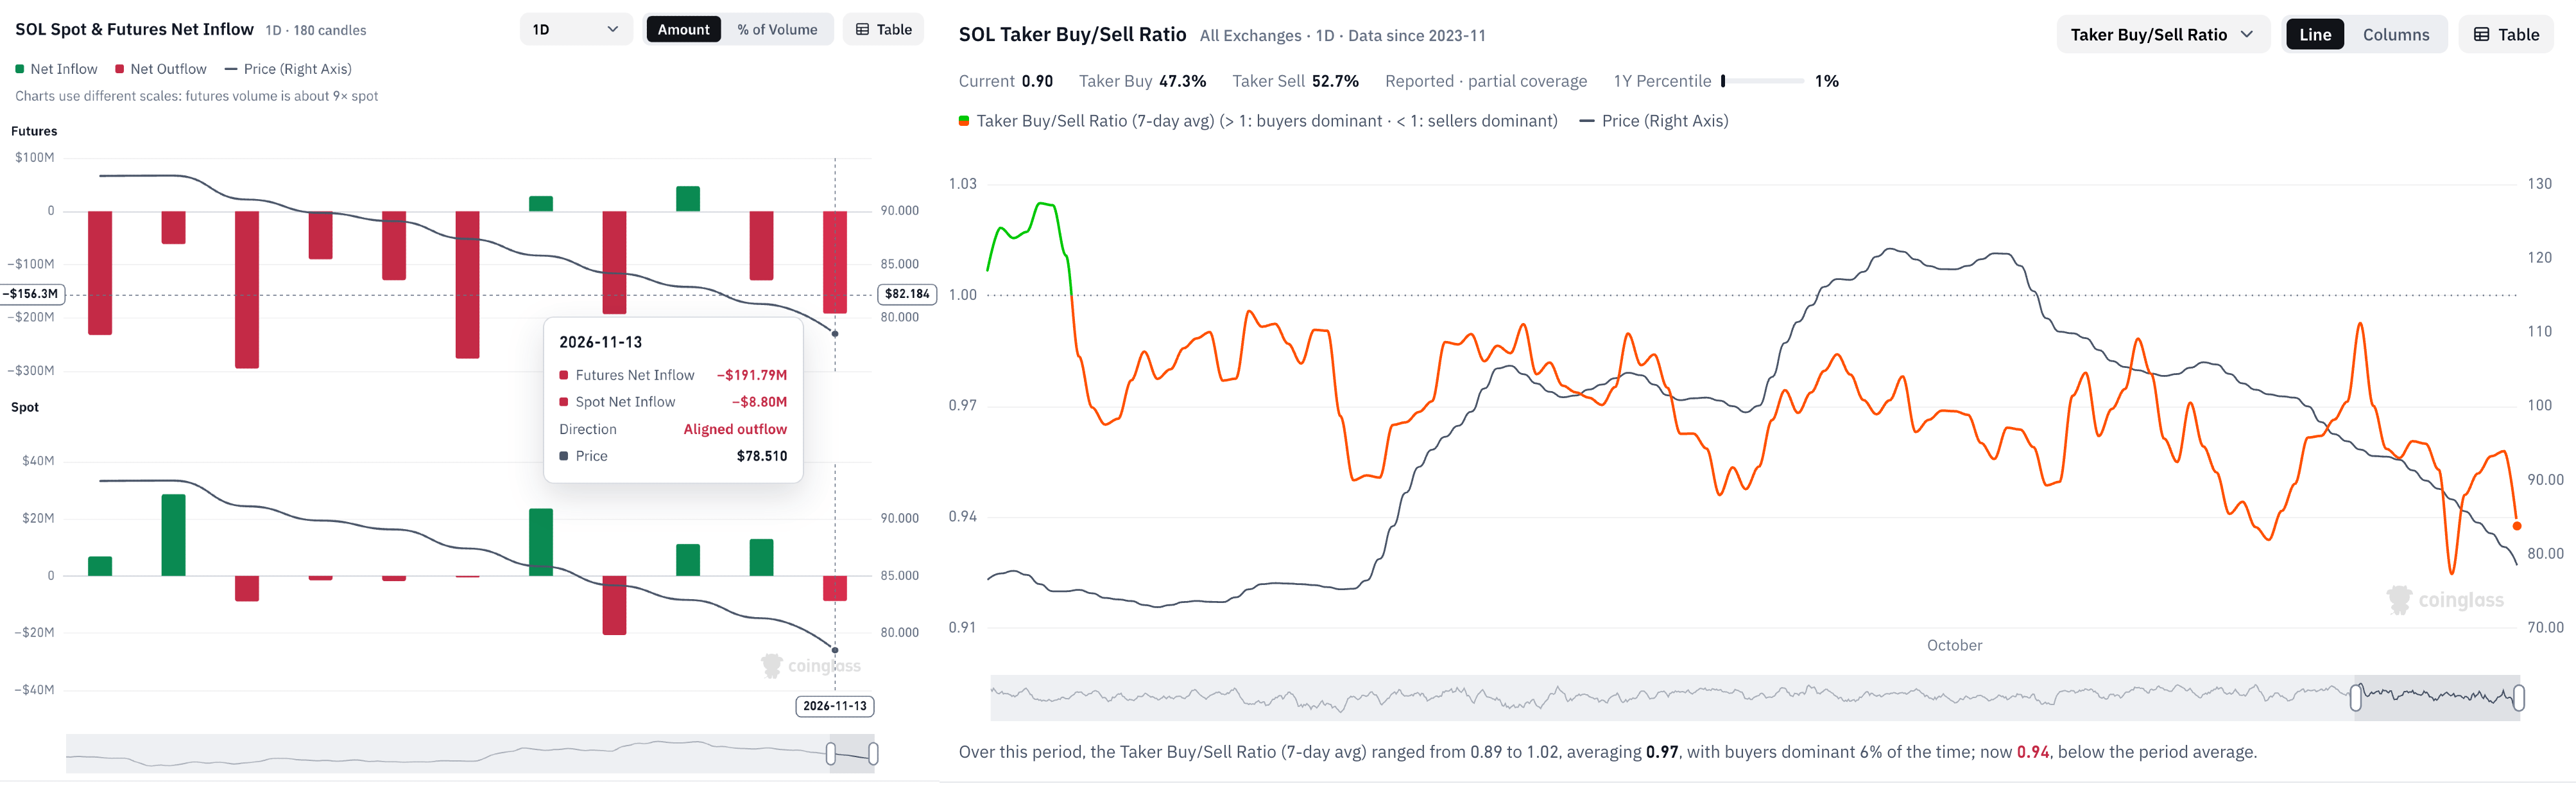
SOL derivatives data. Source: CoinGlass

Technical outlook: Will SOL crash to $70?

Solana hovers around $78.33 on Friday, continuing its steady decline after peaking above $120 in early October. The 50-day Exponential Moving Average (EMA) at $97.55 has fallen below the 200-day EMA at $98.62, forming a Death Cross pattern that indicates a bearish trend reversal.

The pair has also slipped beneath a previously supporting ascending trendline, now a broken barrier near $91.20, reinforcing the notion of a completed upswing. The immediate support for SOL stands at the $77.60 horizontal level, where a confirmed breakout could extend downside risk to $67.50.

Momentum conditions remain heavy, with the Relative Strength Index (RSI) pressed into oversold territory around 19 and the Moving Average Convergence Divergence (MACD) staying below zero, with the signal line at -0.96, hinting that selling pressure is gaining traction.

Chart Analysis SOL/USDT (Binance)
SOL/USDT daily price chart.

On the topside, initial resistance emerges at $87.46, followed by the horizontal cap at $95.82, before the more congested band of the 50-day and 200-day EMAs at $97.55 and $98.62 steps in as trend-defining supply.

(The technical analysis of this story was written with the help of an AI tool. Know more.)

Disclaimer: For information purposes only. Past performance is not indicative of future results.
placeholder
Gold Price Analysis Today | Forex Gold Analysis | XAU/USD Analysis - November 11, 2026Get the latest gold price analysis, forex gold insights, and XAU/USD analysis for November 11, 2026. Read on for the details.
Author  Mitrade
Nov 11, Wed
Get the latest gold price analysis, forex gold insights, and XAU/USD analysis for November 11, 2026. Read on for the details.
placeholder
Bitcoin lost its 200-day average — but the exit started three sessions before the CPIBitcoin fell 2.5% to about $73,400 on 11 November, an 11-week low, breaking its 200-day moving average near $73,100. The 24-hour liquidation tally reached $632 to $705 million, roughly 82% of it longs. But spot ETF outflows began three sessions earlier and USDT's market cap has shrunk $6.6 billion in 60 days — the leveraged length left before the inflation print did. A double top at 81,890 and 81,080 leaves a measured target of 69,366.
Author  Suzie
Nov 11, Wed
Bitcoin fell 2.5% to about $73,400 on 11 November, an 11-week low, breaking its 200-day moving average near $73,100. The 24-hour liquidation tally reached $632 to $705 million, roughly 82% of it longs. But spot ETF outflows began three sessions earlier and USDT's market cap has shrunk $6.6 billion in 60 days — the leveraged length left before the inflation print did. A double top at 81,890 and 81,080 leaves a measured target of 69,366.
placeholder
Gold Extends Slide Below $4,000 as Rising US Inflation, Fed December Hike Bets Pressure Prices On November 12, gold prices (XAUUSD) extended their recent losses, falling further below $4,000 in early Asian trading to hit an intraday low near $3,968, marking a third consecutive day
Author  TradingKey
Yesterday 02: 00
On November 12, gold prices (XAUUSD) extended their recent losses, falling further below $4,000 in early Asian trading to hit an intraday low near $3,968, marking a third consecutive day
placeholder
Nvidia slid 7.7% after hours while AMD and Broadcom rose — the AI trade changed hands, it didn't breakNvidia closed Wednesday at 173.73, up 2.87%, then fell as much as 8.1% to 159.44 after reports that its board was preparing for a possible leadership change. The same session, the Philadelphia Semiconductor Index rose 5.7% with all 30 components higher, CoreWeave jumped 24.7% on 168% revenue growth, and Micron added 11.9%. If AI demand were being repriced, AMD and Broadcom would not be bid. This is a governance discount on one name, and 204.54 — the 200-day average — is the level that settles it.
Author  Irene Q.
Yesterday 02: 45
Nvidia closed Wednesday at 173.73, up 2.87%, then fell as much as 8.1% to 159.44 after reports that its board was preparing for a possible leadership change. The same session, the Philadelphia Semiconductor Index rose 5.7% with all 30 components higher, CoreWeave jumped 24.7% on 168% revenue growth, and Micron added 11.9%. If AI demand were being repriced, AMD and Broadcom would not be bid. This is a governance discount on one name, and 204.54 — the 200-day average — is the level that settles it.
placeholder
Gold closed below $4,000 again — the ETF crowd and central banks stayed, the momentum money leftSpot gold is trading near $3,999, its third consecutive lower daily low, after a 5.00% 10-year yield and a 102.85 dollar index raised the odds of a December hike to 87%. But the selling is not coming from the strategic holders: managed-money net longs fell to 324 tonnes, a 21-week low, and Goldman Sachs attributes roughly 95% of five weeks of selling to non-reportable positions. ETFs still hold a record 4,256 tonnes and central banks bought 321 tonnes in Q3. The table below sets the triggers, directions and levels.
Author  Irene Q.
Yesterday 03: 20
Spot gold is trading near $3,999, its third consecutive lower daily low, after a 5.00% 10-year yield and a 102.85 dollar index raised the odds of a December hike to 87%. But the selling is not coming from the strategic holders: managed-money net longs fell to 324 tonnes, a 21-week low, and Goldman Sachs attributes roughly 95% of five weeks of selling to non-reportable positions. ETFs still hold a record 4,256 tonnes and central banks bought 321 tonnes in Q3. The table below sets the triggers, directions and levels.
Related Instrument
goTop
quote