




Most traders draw support and resistance levels as thin lines. Price then slices through them by a few pips and the trade gets stopped out.
The problem is rarely the level itself. The problem is treating a price area like an exact number.
This guide shows how to use support and resistance levels when trading CFDs in Australia. You will see real charts of AUD/USD and gold with zones marked on them.
You will also see how one zone becomes a full trade plan. That means an entry, a stop loss, a target and a fixed dollar risk.
What Are Support and Resistance Levels?
Support is a price area where buying has stopped a fall before, and resistance is a price area where selling has stopped a rise before.
Traders watch these areas because the same buyers and sellers often return to them. Orders cluster there, so price tends to react.
Support sits below the current price. Resistance sits above it.
Neither one is a wall. Each is a place where the odds of a reaction rise, nothing more.
Mitrade has a beginner guide that covers the basic idea. This article focuses on using these levels to plan real CFD trades.
Why Support and Resistance Levels Are Zones, Not Lines
Price rarely turns at the exact same tick twice. Some traders buy early, some buy late and some wait for confirmation.
That spread of orders creates a band, not a single price. So the better habit is to draw a zone across the area where candles reacted.
Look at the daily chart of the Australian dollar against the US dollar, AUD/USD.
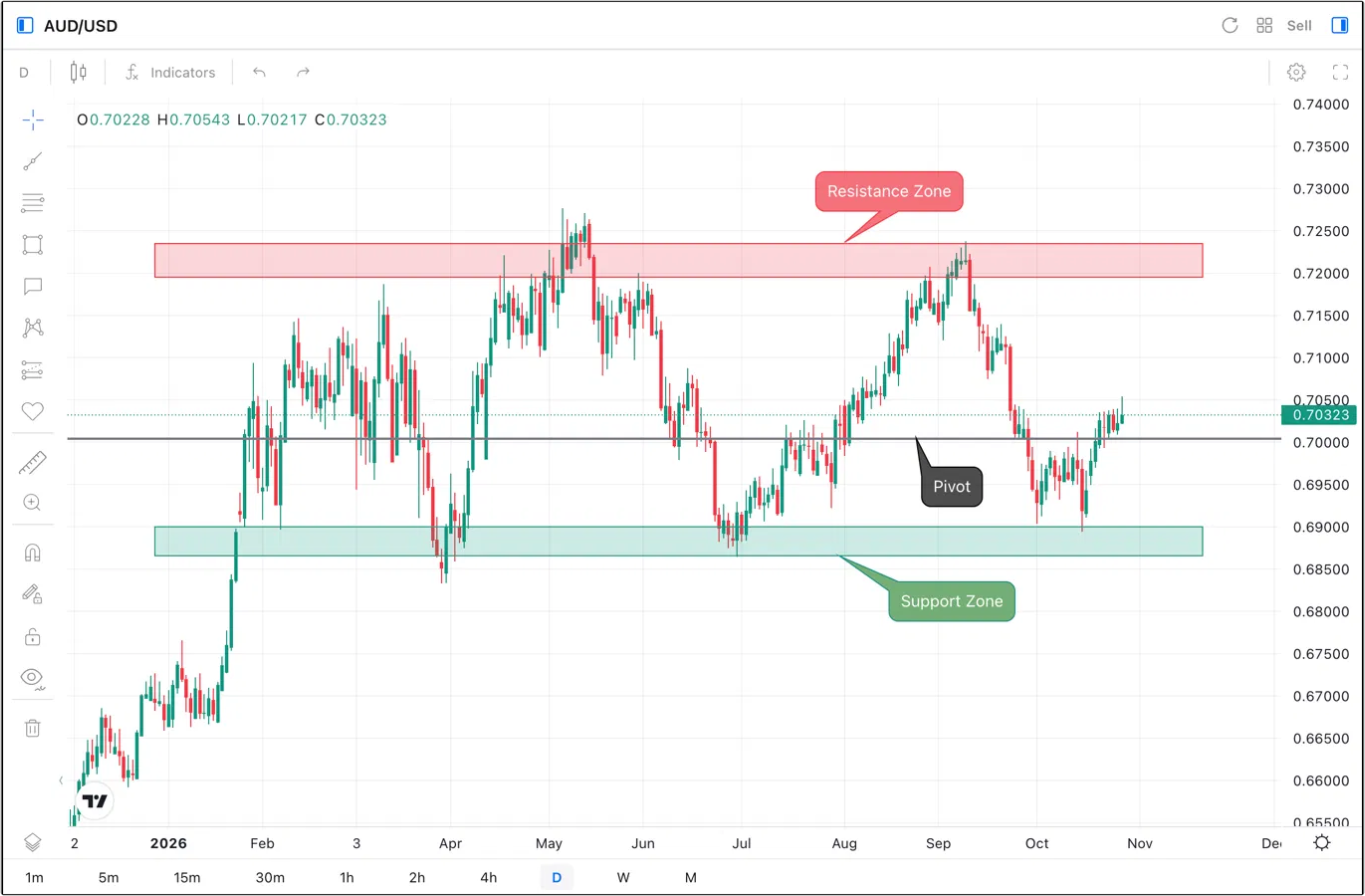
Image: Mitrade (AUD/USD Daily Chart)
The support zone runs from about 0.68658 to 0.69000. Buyers stepped in across that whole band, not at one figure.
The resistance zone runs from about 0.71954 to 0.72365. Sellers capped rallies across that band on several occasions.
In the middle sits 0.70000. Round numbers like this often act as a pivot, because many traders place orders there.
A single line at 0.69000 would have missed the reactions lower in the band. A zone captures where price actually turned.
How to draw a zone
Start on the daily chart, because daily levels attract more attention than intraday ones. Find two or more turning points at a similar price.
Use the bodies and wicks of those candles to set the top and bottom of the zone. Then extend the zone to the right edge of the chart.
If a zone grows very wide, it is probably two separate levels. Split it or drop the weaker one.
How Support and Resistance Levels Switch Roles
A broken support level often becomes resistance later. A broken resistance level often becomes support.
This is called role reversal. It happens because traders who bought at the old support now want to exit near their entry price.
The daily gold chart shows this twice in four months.
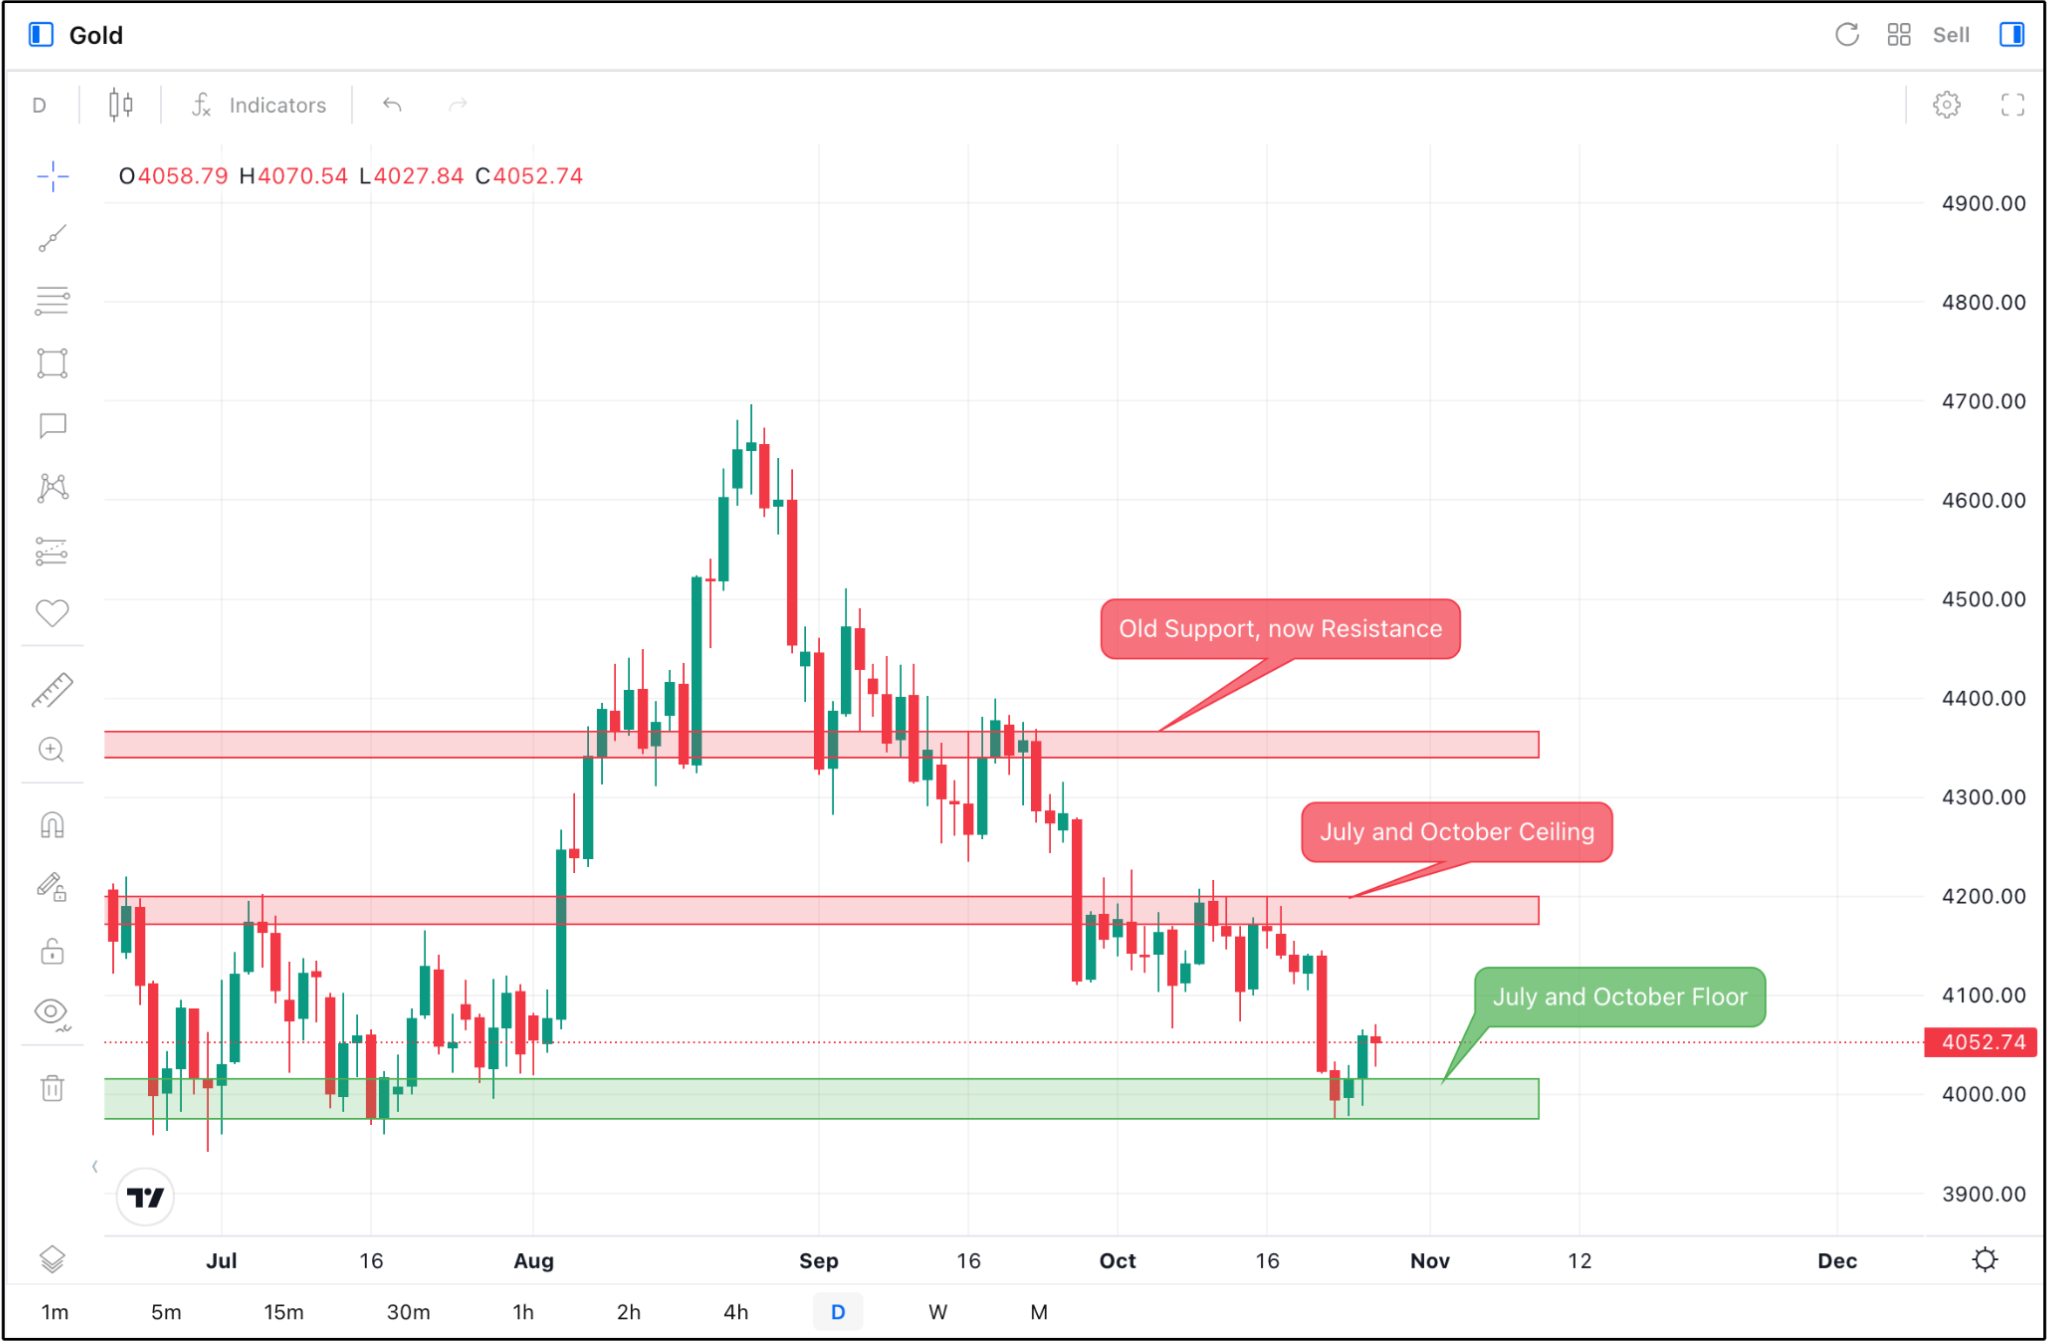
Image: Mitrade (Gold Daily Chart)
The top zone switched from support to resistance
The top zone sits at about 4,340 to 4,365. Gold stalled there in mid August before running close to 4,700 later that month.
In early September, gold fell back into the zone and buyers defended it. The zone acted as support.
Later in September, gold broke below it. When price rallied back, the same zone rejected it from below.
Old support had become new resistance. Gold then dropped towards 4,100 by the end of September.
The middle zone capped gold twice
The middle zone sits at about 4,170 to 4,200. It capped gold in early July.
Gold broke above it in August, so it left the chart for a while. Then October arrived and every rally stopped inside the same band.
That is the value of keeping old zones on your chart. A level from July shaped trading in October.
The floor held twice
The green zone sits at about 3,975 to 4,015. Buyers held it through July.
Gold returned to the same zone in late October and bounced again. At the time of the screenshot, gold traded at 4,052.74.
A zone tested twice, three months apart, carries more weight than a level tested once. Repeat tests show that many traders still care about it.
How to Spot a False Break of Support and Resistance
Not every break is real. Some moves poke through a zone and then snap straight back.
These are false breaks. They trap traders who bought the breakout or sold the breakdown too early.
Look again at the AUD/USD chart. In April, a long wick pushed below the support zone before price closed back inside it.
In May, a spike pushed above the resistance zone. Price then fell back below it within days.
Both moves would have hit stops placed right at the edge of the zone. Both would also have triggered breakout entries that quickly turned into losses.
Three checks before trusting a break
First, wait for a daily close beyond the zone. A wick alone proves very little.
Second, watch for a retest. A true break often returns to the old zone and holds it from the other side, just like gold did in September.
Third, place stops beyond the full zone, not at its edge. The zone already tells you where noise usually ends.
How to Turn a Support and Resistance Zone Into a CFD Trade Plan
A zone is only useful if it leads to a plan. That plan needs four parts before you click anything.
You need an entry, a stop loss, a target and a position size. Here is how each part comes from the AUD/USD chart.
Entry: just above the zone
Rather than chase price, a trader can place a Buy Limit order near the top of the support zone. The order only fills if price comes back down.
In this example, the Buy Limit sits at 0.69050. That is just above the 0.69000 top of the zone.
Stop loss: beyond the whole zone
The stop goes at 0.68550. That is below the 0.68658 bottom of the zone.
If price closes beneath the full zone, the reason for the trade is gone. The stop simply accepts that.
Target: the next level
The target is 0.70000, the round number pivot. It is the next area where sellers are likely to appear.
Aiming past the next level asks price to break through a fresh wall of orders. Taking profit before it is more realistic.
Size: fixed dollar risk
Here is the full order on the Mitrade demo account.
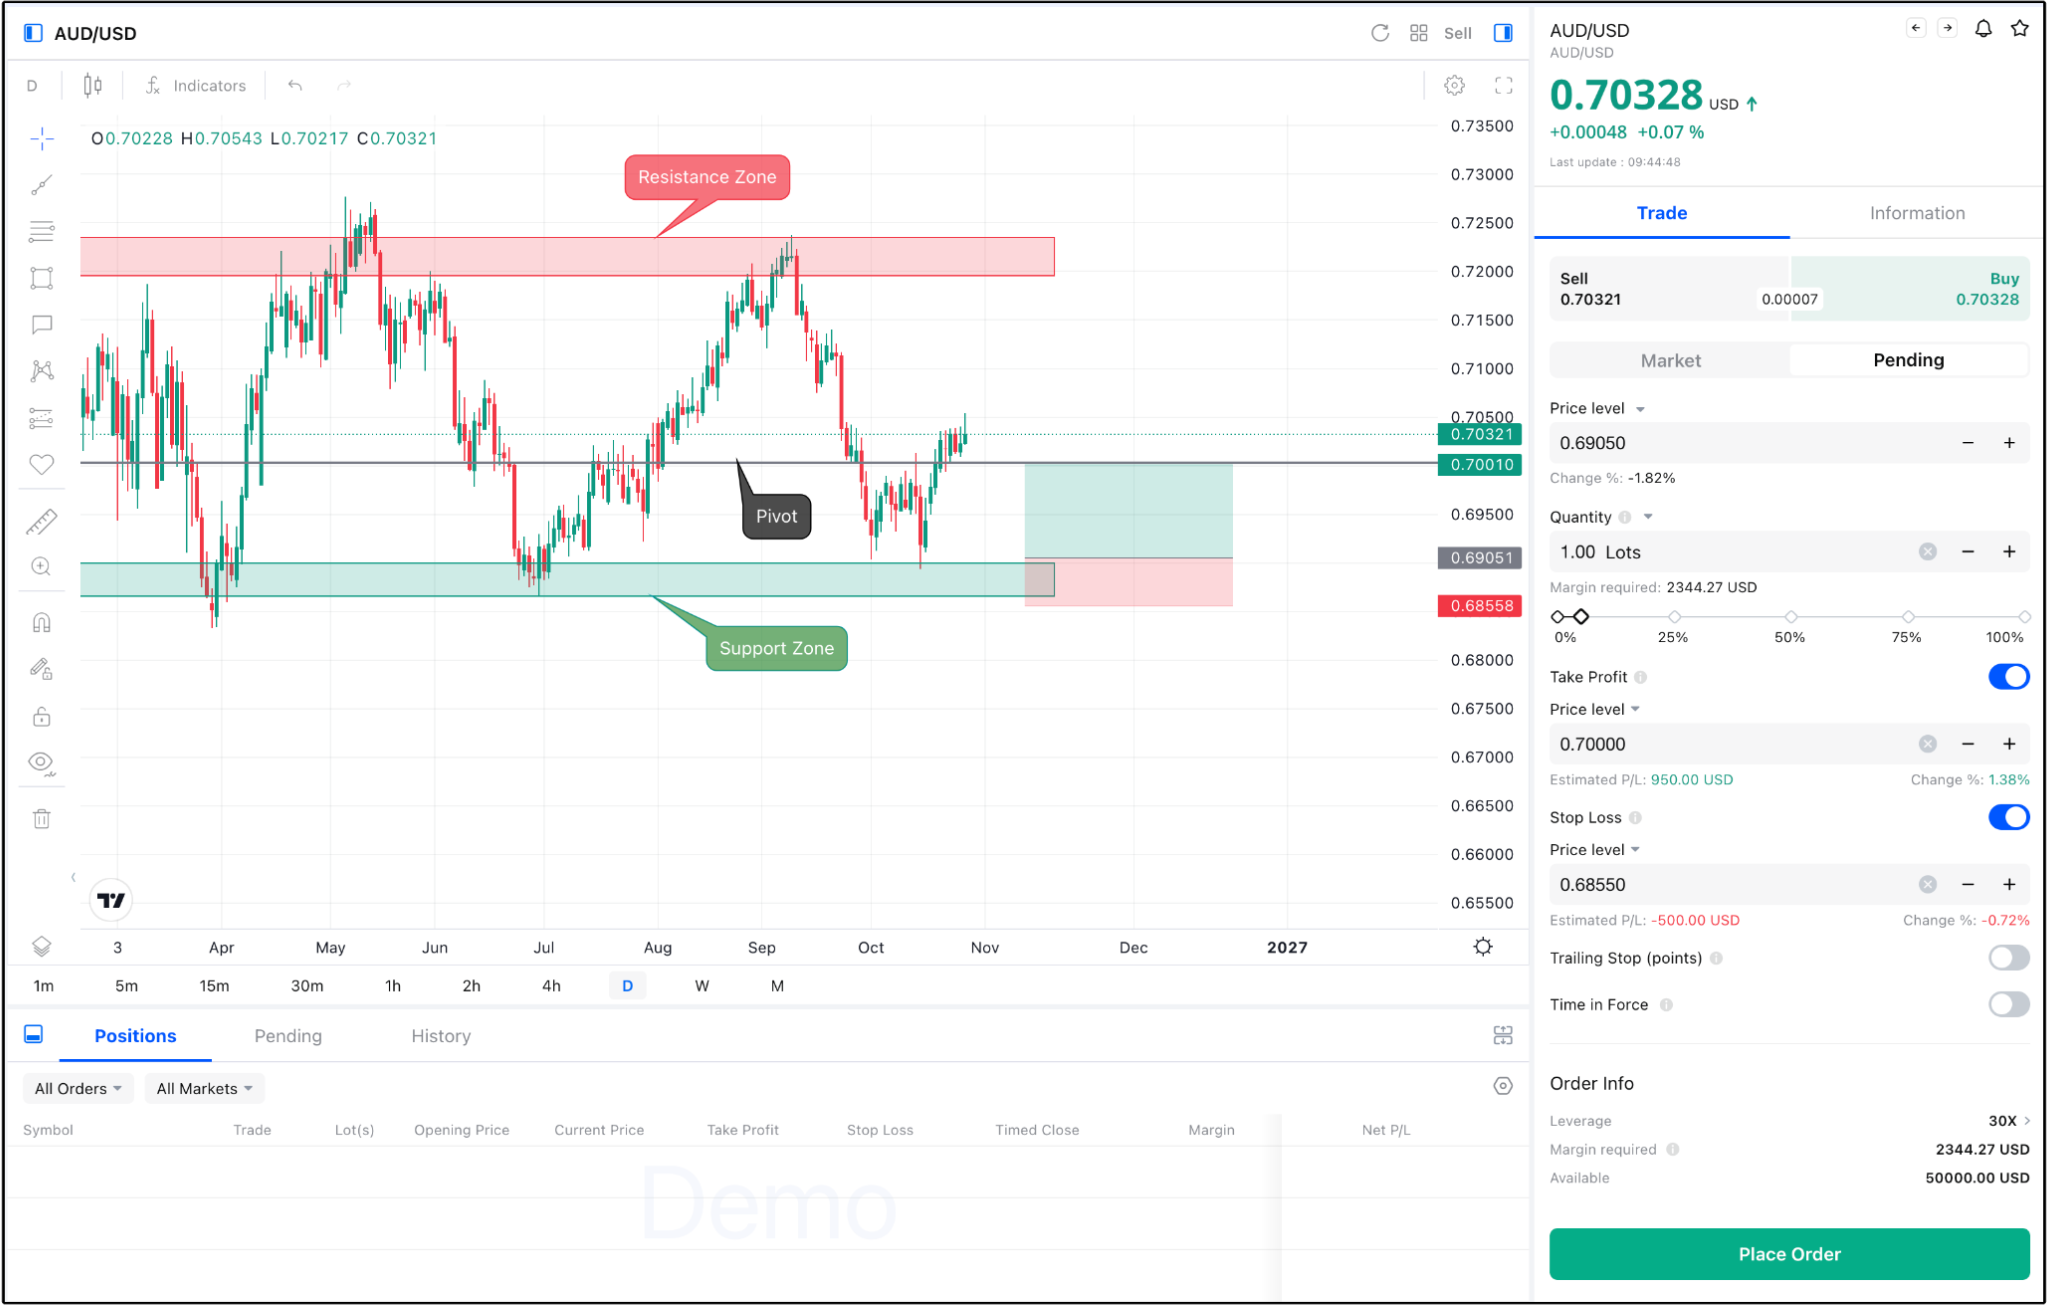
Image: Mitrade (AUD/USD Buy Limit Order)
At 1.00 lot, the estimated loss at the stop is 500. The estimated gain at the target is $950.
That is a reward to risk ratio of about 1.9. On a $50,000 demo balance, the risk is 1% of the account.
The stop is 50 pips away and the target is 95 pips away. The zones chose those distances, not a guess.
If the stop needed to be wider, the lot size would shrink to keep the loss near $500. Our position sizing guide walks through that adjustment step by step.
“Start CFD Trading with an ASIC-regulated broker. Fast AUD funding via PayID. ”
How to Plan a Sell From a Resistance Zone
A trader expecting another rejection could place a Sell Limit near the bottom of that zone. The order would only fill if gold rallied back up.
The stop would sit above 4,200, beyond the whole zone. A close above it would show that sellers had lost control.
The natural target is the next support zone below. On this chart, that is the floor at about 3,975 to 4,015.
Check the distance before you trade
Measure the gap between entry and stop, then the gap between entry and target. If the target is not clearly further away than the stop, skip the trade.
Gold also moves in larger steps than AUD/USD. The same dollar risk will therefore need a much smaller position.
That is why the order screen matters. Adjust the lots until the estimated loss at the stop matches the amount you planned to risk.
Sell trades carry their own risks
Prices can rise without a clear ceiling, so a short position needs a stop just as much as a long one. Never sell a resistance zone without one.
Holding a CFD overnight also adds financing costs. Check them on the order screen, because they can eat into a slow trade.
How Leverage Changes Support and Resistance Trading in Australia
In Australia, retail CFD leverage is capped by the regulator. ASIC set the limits at 30:1 for major currency pairs and lower ratios for other markets, including 20:1 for gold.
The AUD/USD order above shows 30X leverage. Its margin was $2,344.27.
Margin is the deposit to open the trade. It is not the amount at risk.
The risk comes from the distance between entry and stop, multiplied by position size. Leverage only makes it easier to open a position that is too large.
That is why the zone decides the stop and the stop decides the size. Leverage should come last in the process, never first.
Gaps can skip your stop
CFD prices can gap over weekends or after big news. A stop below a zone may fill at a worse price than planned.
Gold and AUD/USD both react sharply to US data and Reserve Bank of Australia decisions. Check the calendar before holding a trade near a zone through a major release.
Common Support and Resistance Mistakes CFD Traders Make
Most losses around key levels come from a short list of habits. Each one is easy to fix.
Drawing too many levels. A chart with ten lines tells you nothing. Keep the two or three zones that price respected most.
Using lines instead of zones. Thin lines invite stops inside the noise. Zones push stops to safer ground.
Placing stops at the zone edge. The April wick on AUD/USD shows why this fails. Put the stop beyond the full zone.
Ignoring role reversal. Deleting a broken level throws away useful information. Gold proved that in September and October.
Trading the first touch of a break. Wait for a daily close and a retest before acting.
Sizing from leverage, not from the stop. Fix your dollar risk first, then let the stop distance set the lots.
If you trade forex from Australia, our forex guide covers the wider basics alongside this one.


You might be interested in…
1. What is the difference between support and resistance?
Support is an area below price where buying has stopped falls before. Resistance is an area above price where selling has stopped rallies before.
2. How do I draw support and resistance levels?
Find two or more turning points at a similar price on the daily chart. Draw a rectangle across the candle bodies and wicks that reacted there.
3. Which timeframe works best for support and resistance?
The daily chart is a good starting point for key zones. Many traders then use shorter timeframes to fine tune entries inside those zones.
4. What happens when a support level breaks?
The broken support often turns into resistance. Gold showed this in September when its old support zone rejected a rally from below.
5. Should my stop loss go exactly on support?
No. Place it beyond the full zone, so normal wicks and noise do not take you out of a valid trade.
6. Can I use support and resistance on the Mitrade platform?
Yes. Mitrade charts include drawing tools for zones, and the order screen shows the estimated profit or loss at your stop and target before you place the trade.
Disclaimer: The content presented above, whether from a third party or not, is considered as general advice only. CFD trading involves significant risk of loss. Past performance does not guarantee future results. This article serves informational purposes only and does not constitute financial advice. Consider your risk tolerance before trading.


