




Is the Crypto Winter Over? Bitcoin's Rally Faces Its First Real Test in Q4

For a few days in September, it looked like the crypto winter was finally over. Bitcoin surged to an eight month high, record money poured into Bitcoin ETFs, and traders betting against it were forced to buy back in.
Three weeks later, the picture is less clear. Bitcoin has slipped back toward US$82,000, US inflation has come in hotter than expected, and US bond yields have climbed above 5%.
This guide looks at what drove the breakout, why it has stalled, and the signals that will show whether the recovery is real. Mitrade, regulated by ASIC, lets Australian traders go long or short on Bitcoin and Ethereum from one account.
Is the Crypto Winter Over? Where Bitcoin Stands Now
A crypto winter is a long period of falling prices, weak trading activity and fading investor interest across the cryptocurrency market, usually following a major peak.
Crypto has been through several winters before, most notably in 2018 and 2022. Each one followed a speculative peak, and each ended only after prices stopped making new lows and fresh money returned to the market.
Bitcoin hit its all time high of US$126,198 on October 6, 2025. What followed was a classic winter, with the price sliding through late 2025 and into 2026.
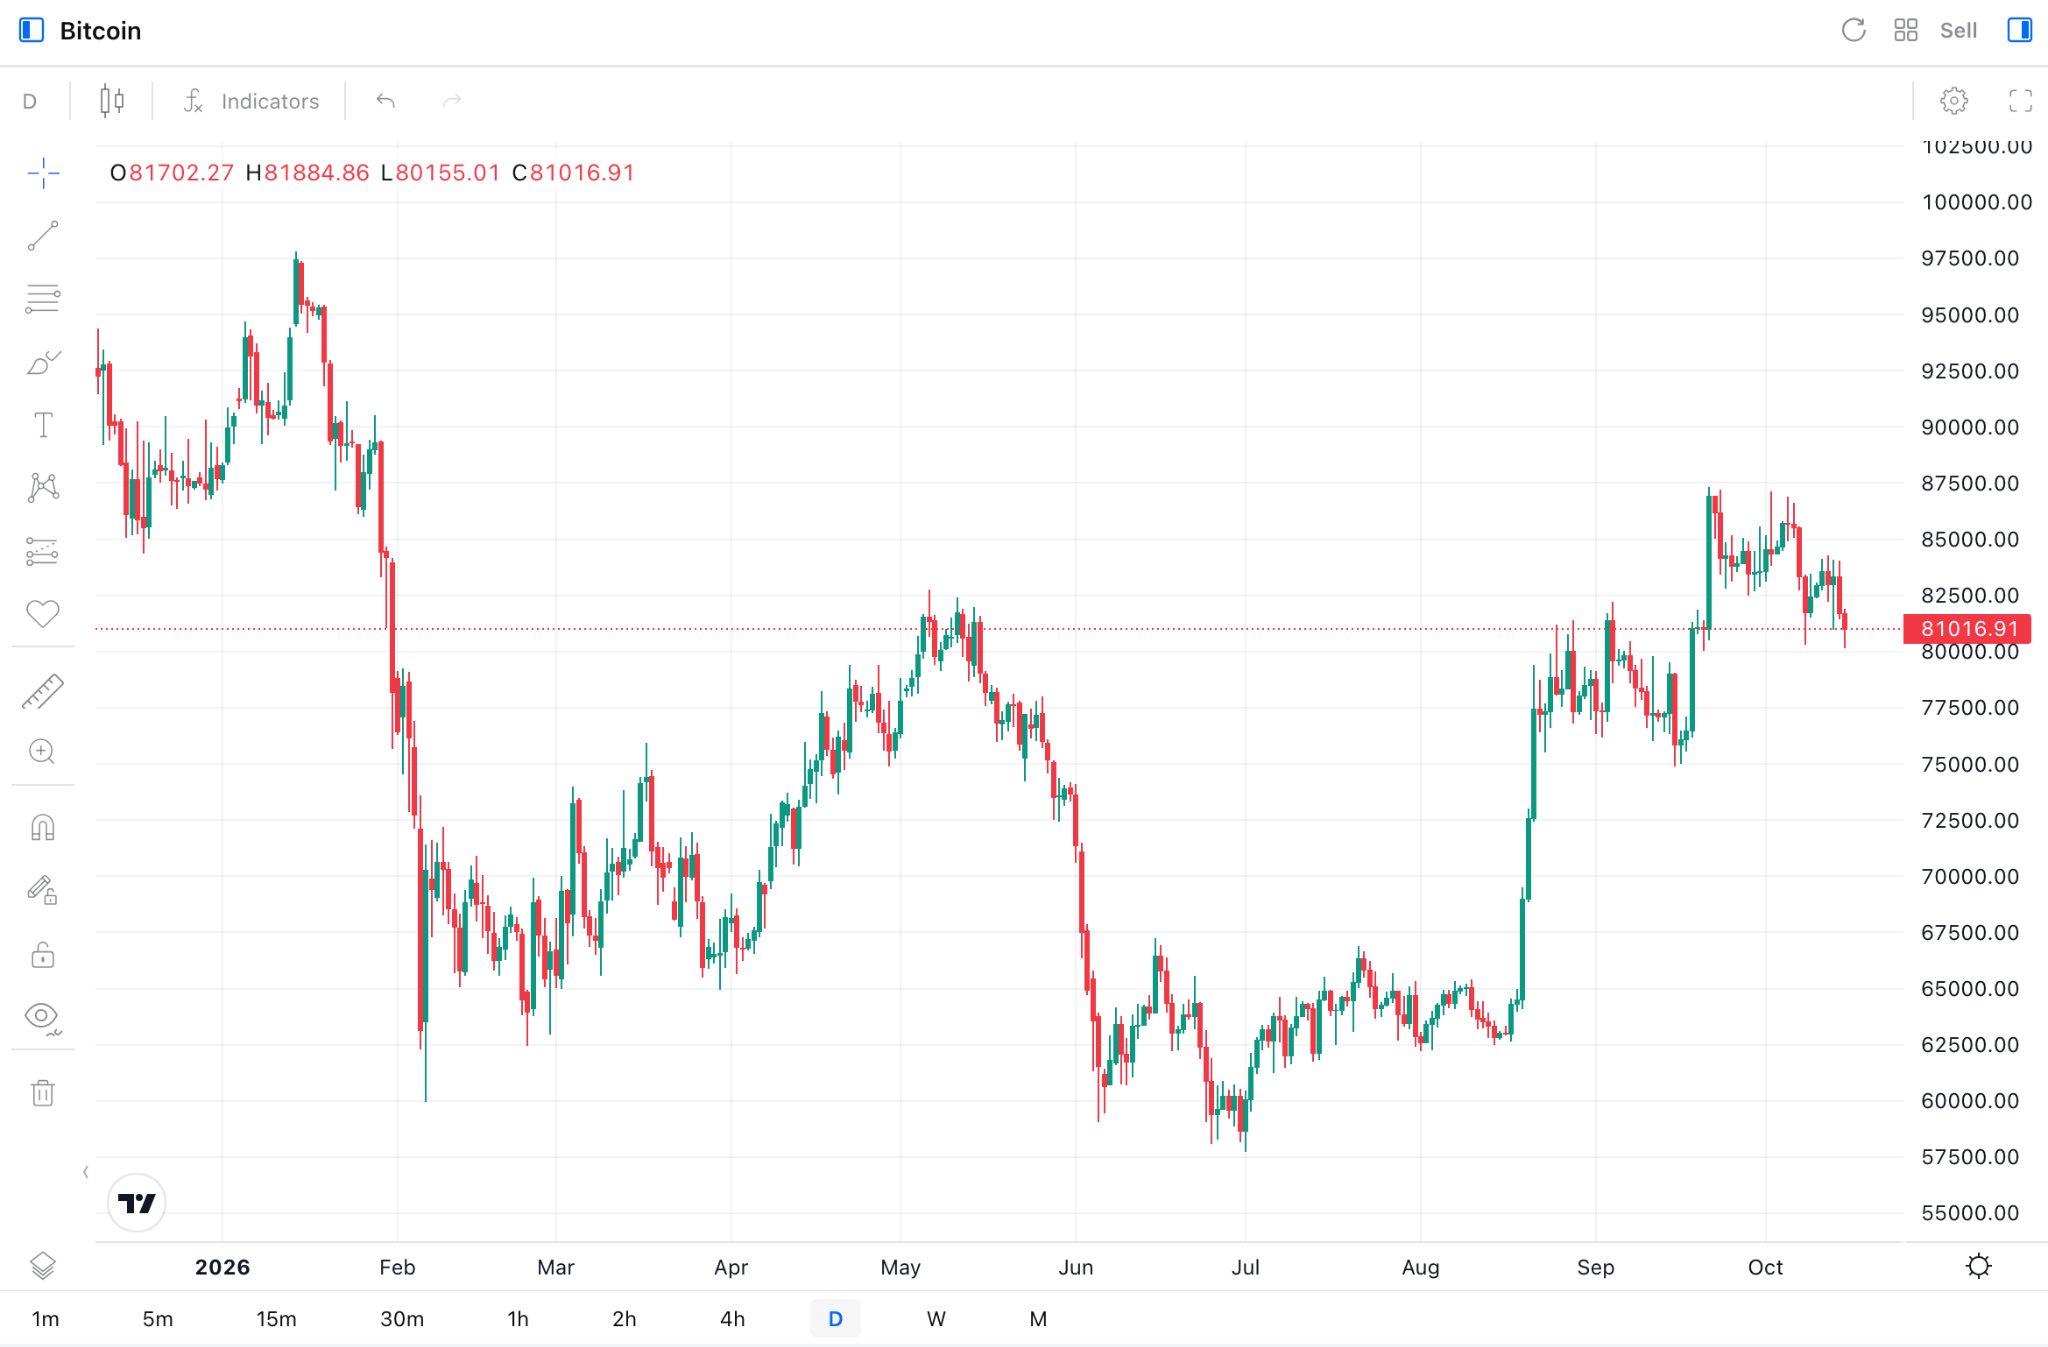
Image: Mitrade (BTC/USD Daily Chart)
The Mitrade chart shows how deep that slide went. Bitcoin peaked near US$97,500 in mid January, then crashed in early February toward US$60,000.
It recovered to around US$83,000 in May before falling again, setting a 2026 low near US$58,000 in late June. From there, Bitcoin climbed steadily and broke out sharply in late August and September.
Bitcoin traded near US$83,900 on October 13. At that point it was up 9.72% over the past month and 18.76% over six months, but still down 5.1% year to date and 27.35% over the past year.
Those numbers capture the debate perfectly. The short term trend has turned up, while the longer term picture still looks like a market in recovery rather than a new bull run.
“Trade Bitcoin CFDs with an ASIC-regulated broker. Fast AUD funding via PayID. ”
What Powered the September Breakout
Two forces drove Bitcoin's September surge. The first was a return of institutional money through US spot Bitcoin ETFs.
On September 21, Bitcoin ETFs took in net inflows of US$999 million, the largest single day of 2026. Another US$714.7 million followed the next day, bringing two day inflows to roughly US$1.7 billion.
The second force was a short squeeze. Traders who had bet on further falls were forced to buy back Bitcoin as the price rose, with hundreds of millions of dollars in short positions liquidated around September 21.
That combination pushed Bitcoin to an intraday high of US$87,397, its highest level in eight months. As one analyst put it, the squeeze explained how fast Bitcoin moved, but not why.
The same analyst argued that new capital was arriving through Wall Street rather than through crypto markets directly. That is an important shift, because ETF demand tends to be steadier than the leveraged trading that drove past crypto rallies.
Why the Rally Has Stalled: Rising Yields
The biggest threat to the recovery is not inside crypto at all. It is the US bond market.
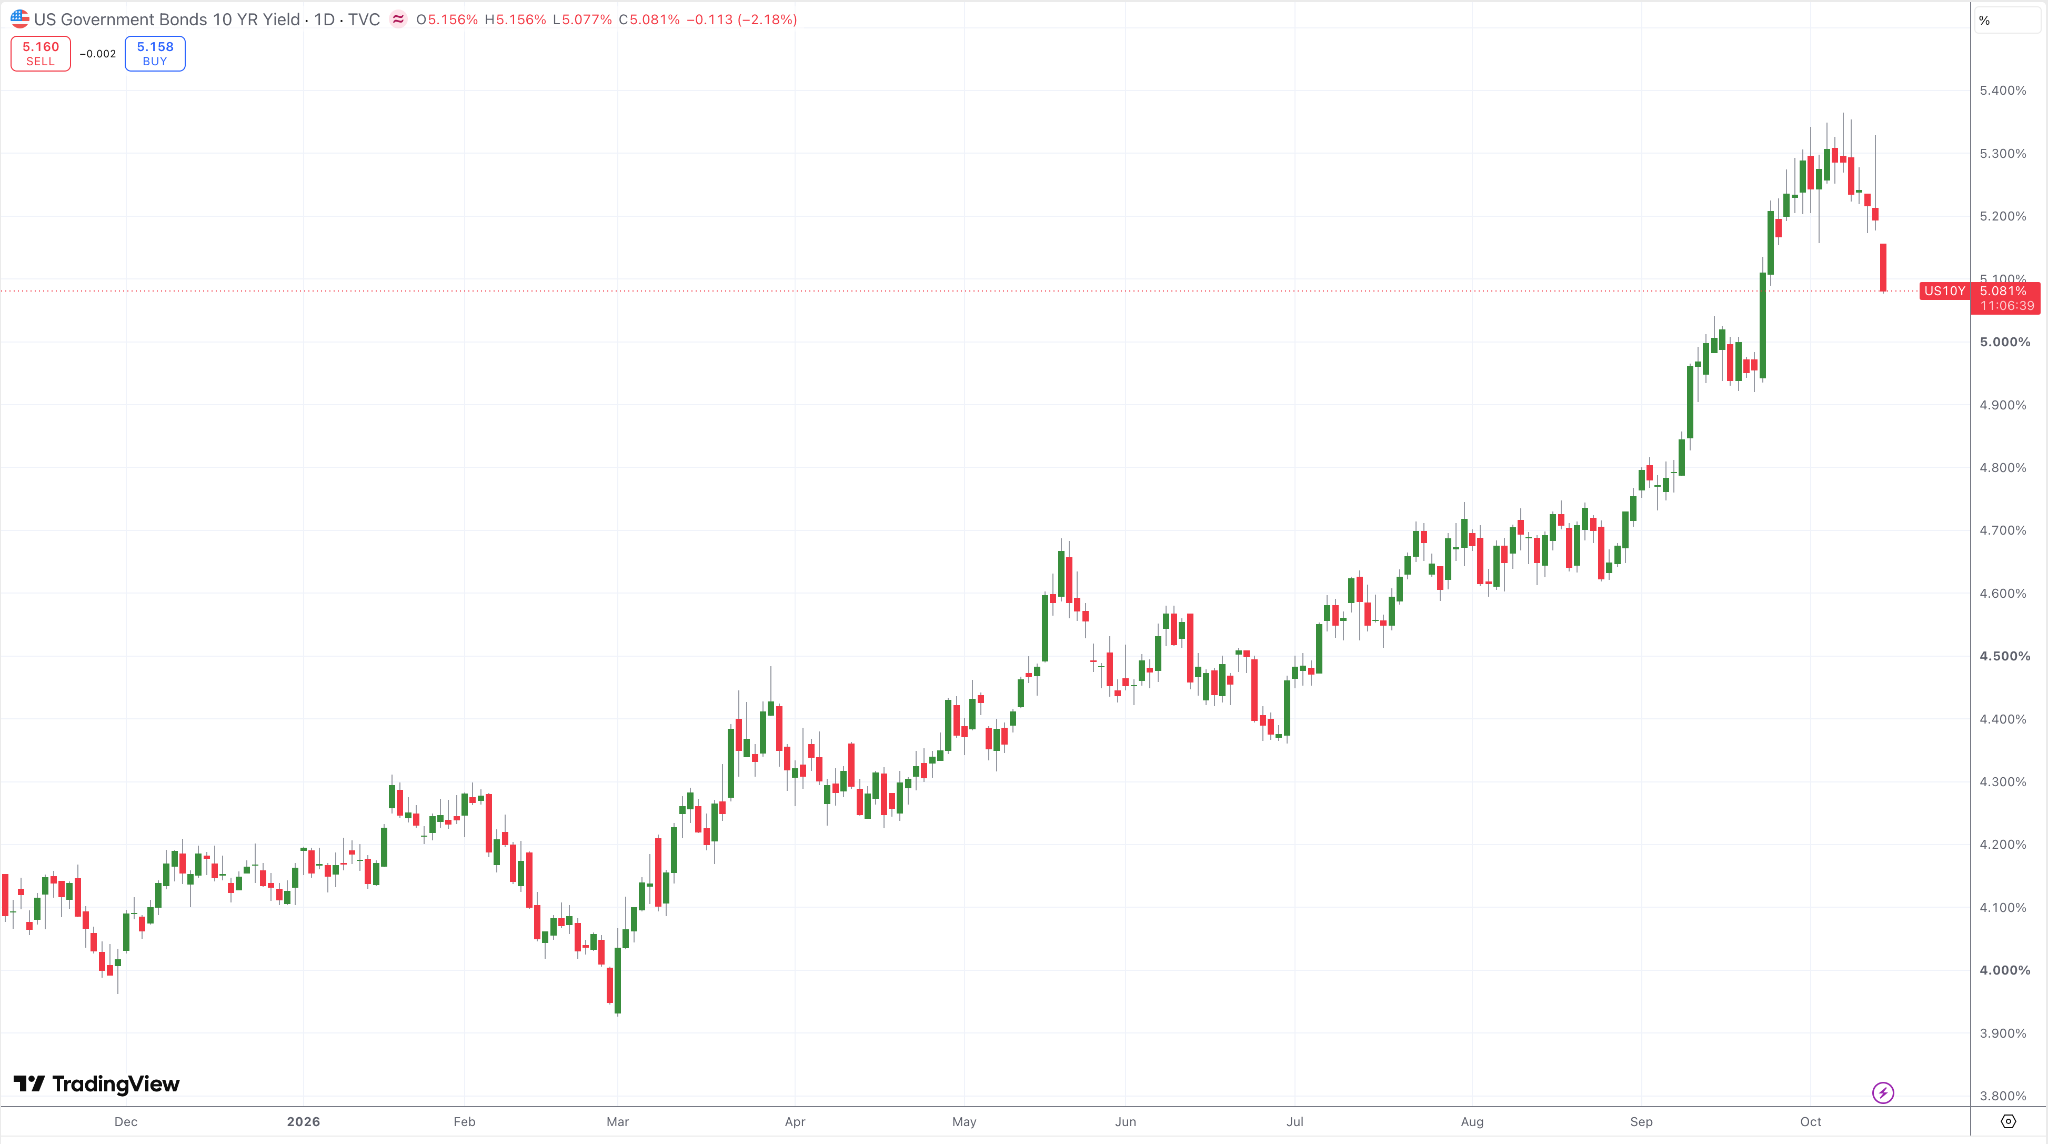
Image: TradingView (US 10 Year Treasury Yield Daily Chart)
The chart shows the US 10 year Treasury yield climbing steadily through 2026. It rose from below 4% in late February to above 5% in September, peaking near 5.3% in early October.
The yield sat around 5.19% on October 13. When safe government bonds pay more than 5%, assets that pay no income, like Bitcoin, become harder to justify for many investors.
Inflation has now added to that pressure. US consumer prices rose 3.7% in the year to September, above the 3.6% expected, and CME FedWatch odds of an October Fed hike jumped to about 50-50.
Bitcoin reacted quickly. It slipped to around US$81,900 on October 14, while Ethereum fell to about US$2,430.
ETF flows have already turned. Spot Bitcoin ETFs saw net outflows of US$678.9 million in the week of October 5 to 9, as rising yields and a stronger US dollar reduced appetite for risk.
The flows are not all one way, though. Bitcoin ETFs took in US$175.6 million on October 13, although October as a whole still shows a net outflow.
Over the year, Bitcoin ETFs have seen outflows on 48% of trading days in 2026, yet still recorded net inflows for the year.
Ethereum Is Telling a Weaker Story
Ethereum has joined the recovery, but with far less strength than Bitcoin. That gap matters for anyone judging whether the whole market is healing.
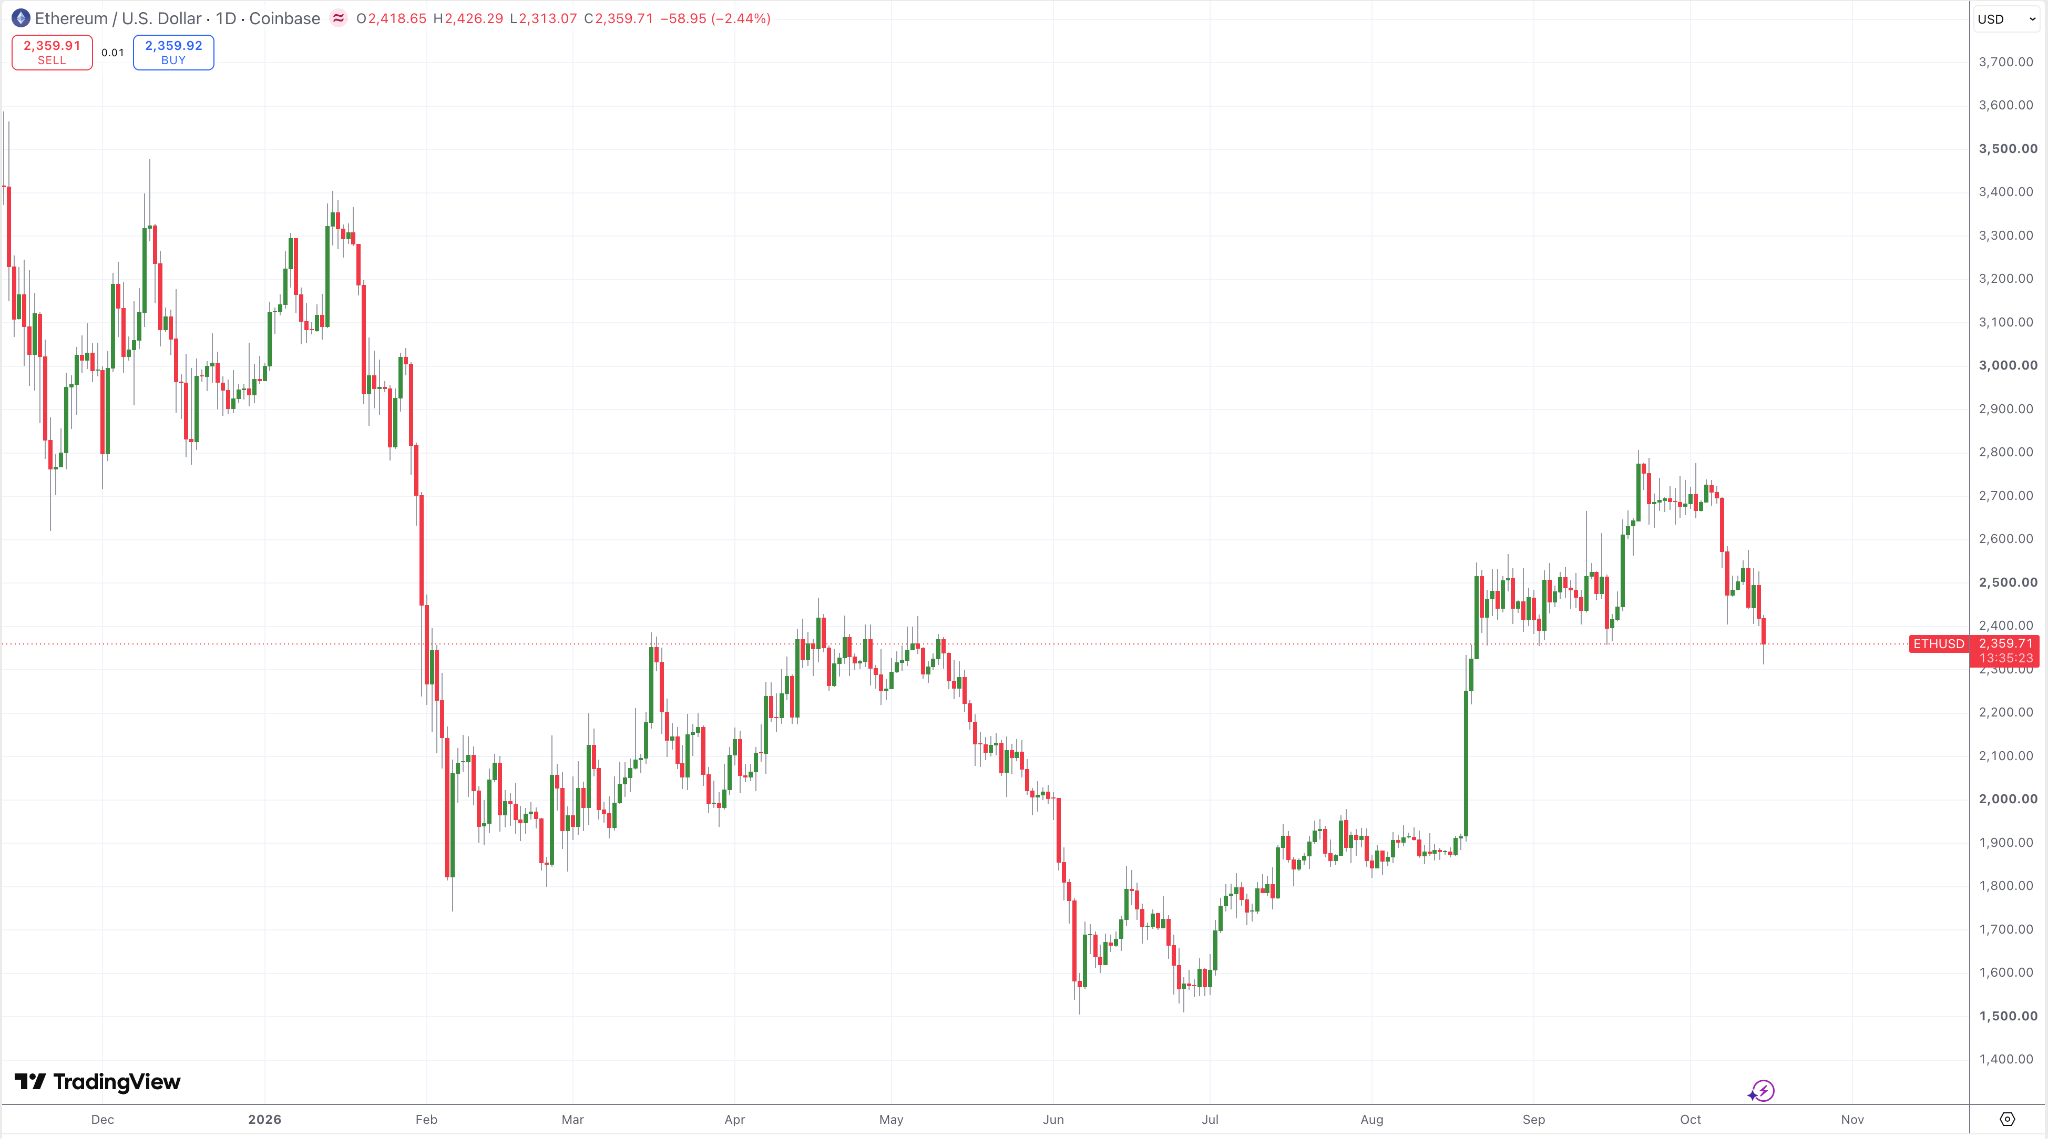
Image: TradingView (ETH/USD Daily Chart)
The chart shows Ethereum peaking near US$3,400 in January before crashing below US$1,800 in February. It hit a 2026 low near US$1,520 in late June.
A sharp August rally lifted Ethereum back above US$2,400, and it peaked near US$2,800 in late September. It traded around US$2,529 on October 13 before slipping toward US$2,430 a day later.
As of October 13, Ethereum was down 6.58% for the week, more than three times Bitcoin's weekly fall. It was also down 15.4% year to date and 40.79% over the past year.
Ethereum ETFs have been hit hardest by recent selling, with redemptions running for nine straight days into October 9. In a true end to crypto winter, Ethereum would usually be catching up with Bitcoin, not falling further behind.
Bitcoin Dominance Shows a Cautious Market
Bitcoin dominance measures Bitcoin's share of the total crypto market's value. It rises when investors favour Bitcoin over smaller, riskier coins.
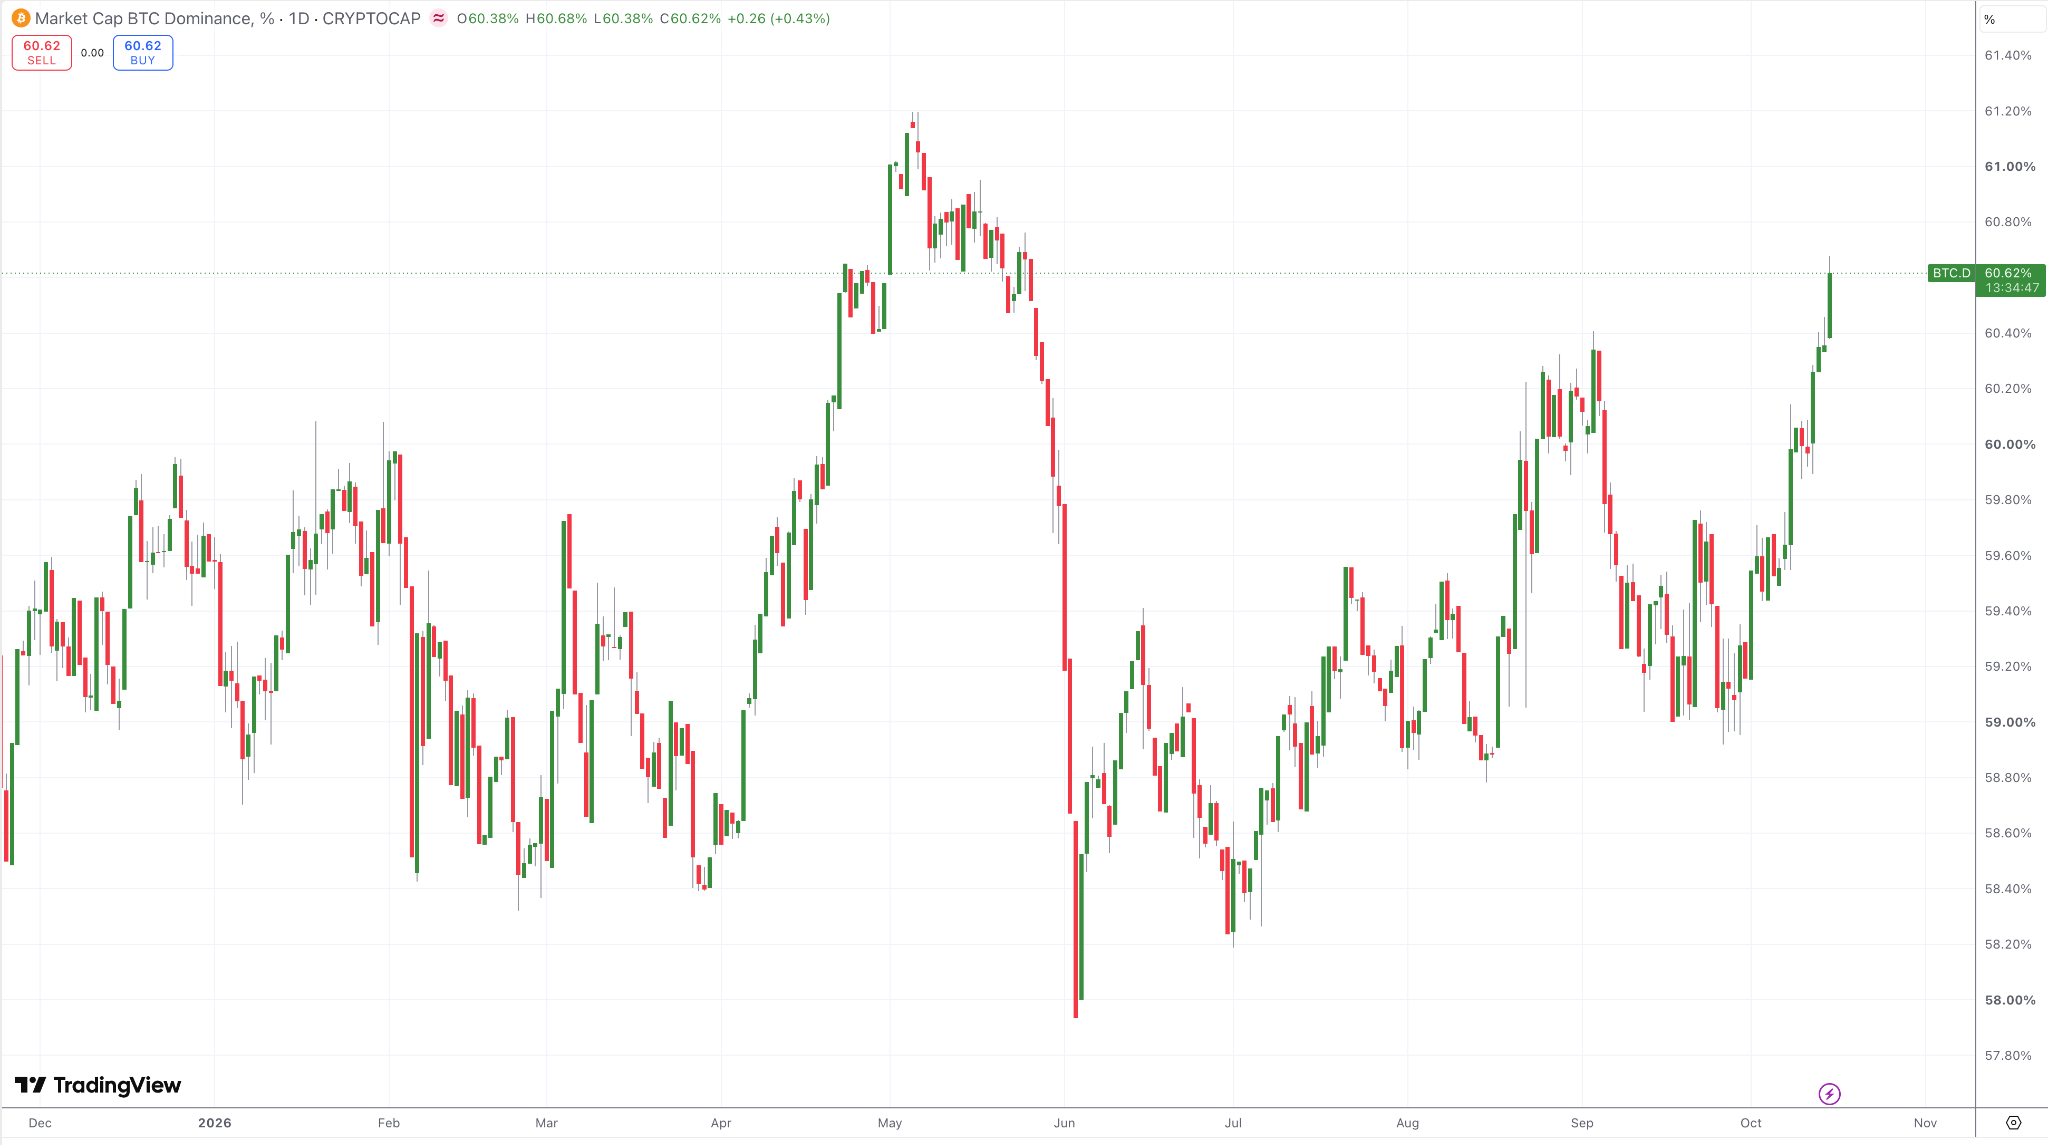
Image: TradingView (Bitcoin Dominance Daily Chart)
The chart shows dominance climbing back to around 60.34%, near the top of its range for the year. It peaked near 61.2% in May and fell toward 58% in June.
Rising dominance during a rally usually signals caution. Investors are buying the most established asset while avoiding the more speculative parts of the market, which is typical of an early, fragile recovery.
When a crypto winter truly ends, money tends to spread out into Ethereum and other altcoins. That broadening has not happened yet.
A turn lower in dominance while Bitcoin holds its gains would be one of the strongest signs that confidence is returning. Until then, the market is backing Bitcoin, but not crypto as a whole.
Three Signals That Would Confirm the Crypto Winter Is Over
Traders do not need to guess. A few clear signals would show the recovery has real strength behind it.
The first is a decisive break above the September high near US$87,400. A daily close above that level would show buyers can push through the point where the breakout stalled.
The second is a return to steady ETF inflows. A few big inflow days are not enough, but several weeks of net buying would show institutions are committing for the long term.
The third is Ethereum outperforming Bitcoin. If Ethereum starts gaining faster and Bitcoin dominance falls, it would signal that risk appetite is spreading across the market.
Three Warning Signs of a Bear Market Rally
The same chart can also tell a darker story. These warning signs would suggest the September move was only a bounce within a longer downtrend.
The first is a break below US$80,000. Bitcoin briefly tested that area this week, and a sustained move lower would undo much of the September breakout.
The second is US yields pushing to new highs above 5.3%. That would raise the pressure on all non yielding assets and likely extend ETF outflows.
The third is a Fed hike on October 28. After the hot September inflation report, markets see roughly even odds of a hike, which could strengthen the US dollar and drain more money from risk assets like crypto.
Broader market risks could add to the pressure. Concerns about an AI bubble in tech stocks and ongoing tension in the Middle East have both weighed on crypto in recent weeks, and a shock on either front could trigger fresh selling.
Key Bitcoin Levels to Watch in Q4
The chart offers clear reference points for the months ahead. Traders can use these levels to plan entries, exits and stop losses.
On the upside, the September high near US$87,400 is the first major barrier. Above that, the January peak near US$97,500 is the level that would confirm a full recovery.
On the downside, US$80,000 is the key support this month. Below it, the September lows near US$76,000 form the next floor before the breakout zone is fully erased.
The range between US$80,000 and US$87,400 is where Bitcoin has traded since late September. Many traders wait for a clean break out of a range like this before committing, because moves inside it often reverse quickly.
For Ethereum, the late September high near US$2,800 is the level to beat. A drop below US$2,400 would take it back into the range it held through most of September.
What This Means for Australian Traders
Bitcoin is priced in US dollars, so Australian traders also face currency risk. The AUD/USD has slipped back below 0.70 in recent weeks, which changes the return Australians see in local terms.
A weaker AUD boosts the value of US dollar assets for Australian holders. That means Bitcoin can look stronger in Australian dollar terms than it does in US dollar terms, even when the underlying price is flat.
The RBA's November decision adds another layer. A surprise rate hike could lift the AUD and trim local returns, while a dovish hold could weaken the AUD and cushion any fall in Bitcoin.
Key Dates for Crypto Traders in Q4
Several events could decide whether the rally resumes or fades. Traders should keep these on their radar through the rest of the year.
October 28: The Fed decision on US interest rates, now a live hike risk after hot inflation data.
November 3: The RBA decision, which can move the AUD and local returns on crypto.
December: Another Fed meeting, which could bring a hike if October passes without one.
Weekly ETF flow data also matters. A run of positive weeks would support the recovery case, while continued outflows would point to a deeper pullback.
How to Trade Bitcoin and Ethereum on Mitrade
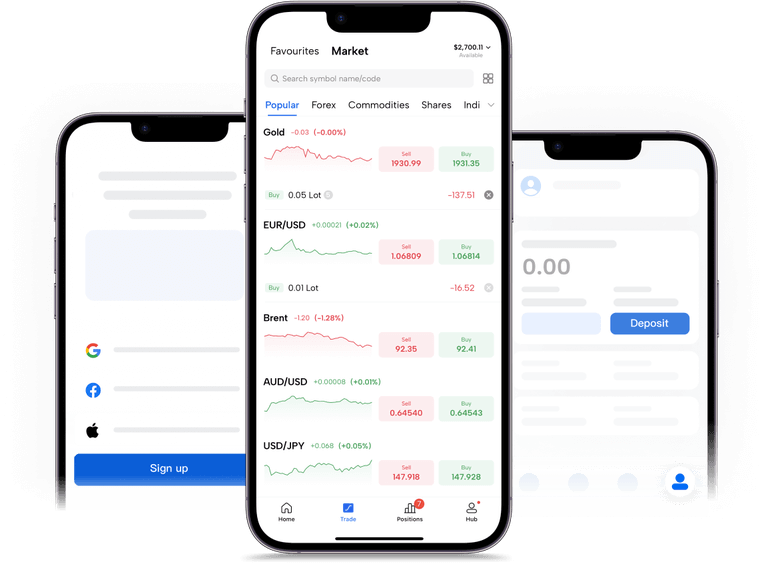
Mitrade offers CFDs on Bitcoin and Ethereum, so traders can go long if they expect the recovery to continue or short if they expect another leg down. Crypto trades around the clock, which means prices can move sharply while Australians sleep.
Under ASIC rules, leverage on crypto CFDs is capped at 2:1, the lowest of any asset class. That reflects how volatile crypto can be, even during a recovery.
Setting a stop loss is especially important in crypto. Mitrade lets traders set a stop loss and take profit on the order screen before placing each trade, which helps manage overnight risk. New traders can also practise on a free demo account before risking real money.


You might be interested in…
1. Is the crypto winter over in 2026?
Not yet confirmed. Bitcoin broke out to an eight month high in September, but it was still down about 5% year to date in mid October and roughly a third below its 2025 record.
2. What caused Bitcoin's September rally?
Record ETF inflows and a short squeeze drove the move. Bitcoin ETFs took in US$999 million on September 21, their largest single day of 2026.
3. Why is Bitcoin falling in October?
Rising US bond yields, hotter than expected US inflation and the growing chance of another Fed hike have reduced appetite for risk. Bitcoin ETFs also recorded net outflows across early October.
4. What is Bitcoin's all time high?
Bitcoin's all time high is US$126,198, set on October 6, 2025. In mid October 2026, it was trading around a third below that level.
5. What Bitcoin levels should traders watch?
The September high near US$87,400 is the key resistance. On the downside, US$80,000 is the main support, followed by the September lows near US$76,000.
6. Can I trade Bitcoin and Ethereum on Mitrade?
Yes. Mitrade is regulated by ASIC and offers CFDs on Bitcoin and Ethereum, with leverage capped at 2:1 and a free demo account for practice.
Disclaimer: The content presented above, whether from a third party or not, is considered as general advice only. CFD trading involves significant risk of loss. Past performance does not guarantee future results. This article serves informational purposes only and does not constitute financial advice. Consider your risk tolerance before trading.


