




How to Trade an ASX 200 Breakout: What Happens When Australia's Benchmark Hits a New All-Time High

The ASX 200 hit an all-time record of 9,296.7 in early August 2026. Five weeks later it sits at 8,706.6, a drop of approximately 590 points from that peak. The breakout happened and then the index immediately gave most of it back.
That is not unusual. It is one of the most common patterns in index trading. All-time highs attract profit-taking from institutions that bought months earlier, short sellers betting on a technical rejection, and retail traders who chase the breakout at exactly the wrong moment. Understanding why this happens and how to position around it is the difference between trading the ASX 200 intelligently and getting caught on the wrong side of a major move.
This guide uses the August 2026 breakout and rejection as the teaching case. It covers what a breakout actually is, what the current chart pattern signals, and how to trade both scenarios from today's levels.
What Is a Breakout and Why All-Time Highs Behave Differently
A breakout occurs when a financial instrument moves above a significant resistance level with enough buying pressure to push it into new territory above that point, typically converting the old resistance level into new support.
Most resistance levels are historical price peaks. When an index approaches those levels, sellers who bought at the prior peak and are sitting at breakeven will often exit, and new short sellers enter bets that the level holds again. This creates selling pressure precisely at resistance. When buying pressure is strong enough to push through all of that, a genuine breakout occurs.
All-time highs behave differently because there are no overhead sellers. Nobody is sitting at a loss above 9,296.7 waiting to sell at breakeven. But it also means the index enters territory where fresh price discovery happens. The profit-takers from the entire rally below 9,296.7 become the sellers instead, and the momentum that drove the breakout can exhaust itself quickly before the next sustained move higher begins.
The ASX 200's 2026 Story: Two Peaks, One Warning Sign
Looking at the full 2026 daily chart, the ASX 200 has formed a pattern that experienced traders recognise immediately. Two peaks at approximately the same level, separated by a sharp decline and a recovery that took months.
The index reached approximately 9,250 in March 2026 before selling off sharply to around 8,250 in April, a drop of approximately 1,000 points in weeks. It recovered through May, June, and July before surging to the all-time high of 9,296.7 in early August. After the record the sharp selloff resumed, bringing the index to 8,706.6 today. Two peaks at approximately 9,250 to 9,300, a major correction between them, and a second rejection that has left the index more than 6% below its high. This is a textbook double top pattern.
The two circled areas show the March 2026 and August 2026 peaks, both rejected at approximately the same level near 9,250 to 9,296. This is the double top pattern that defines the ASX 200's current technical picture.
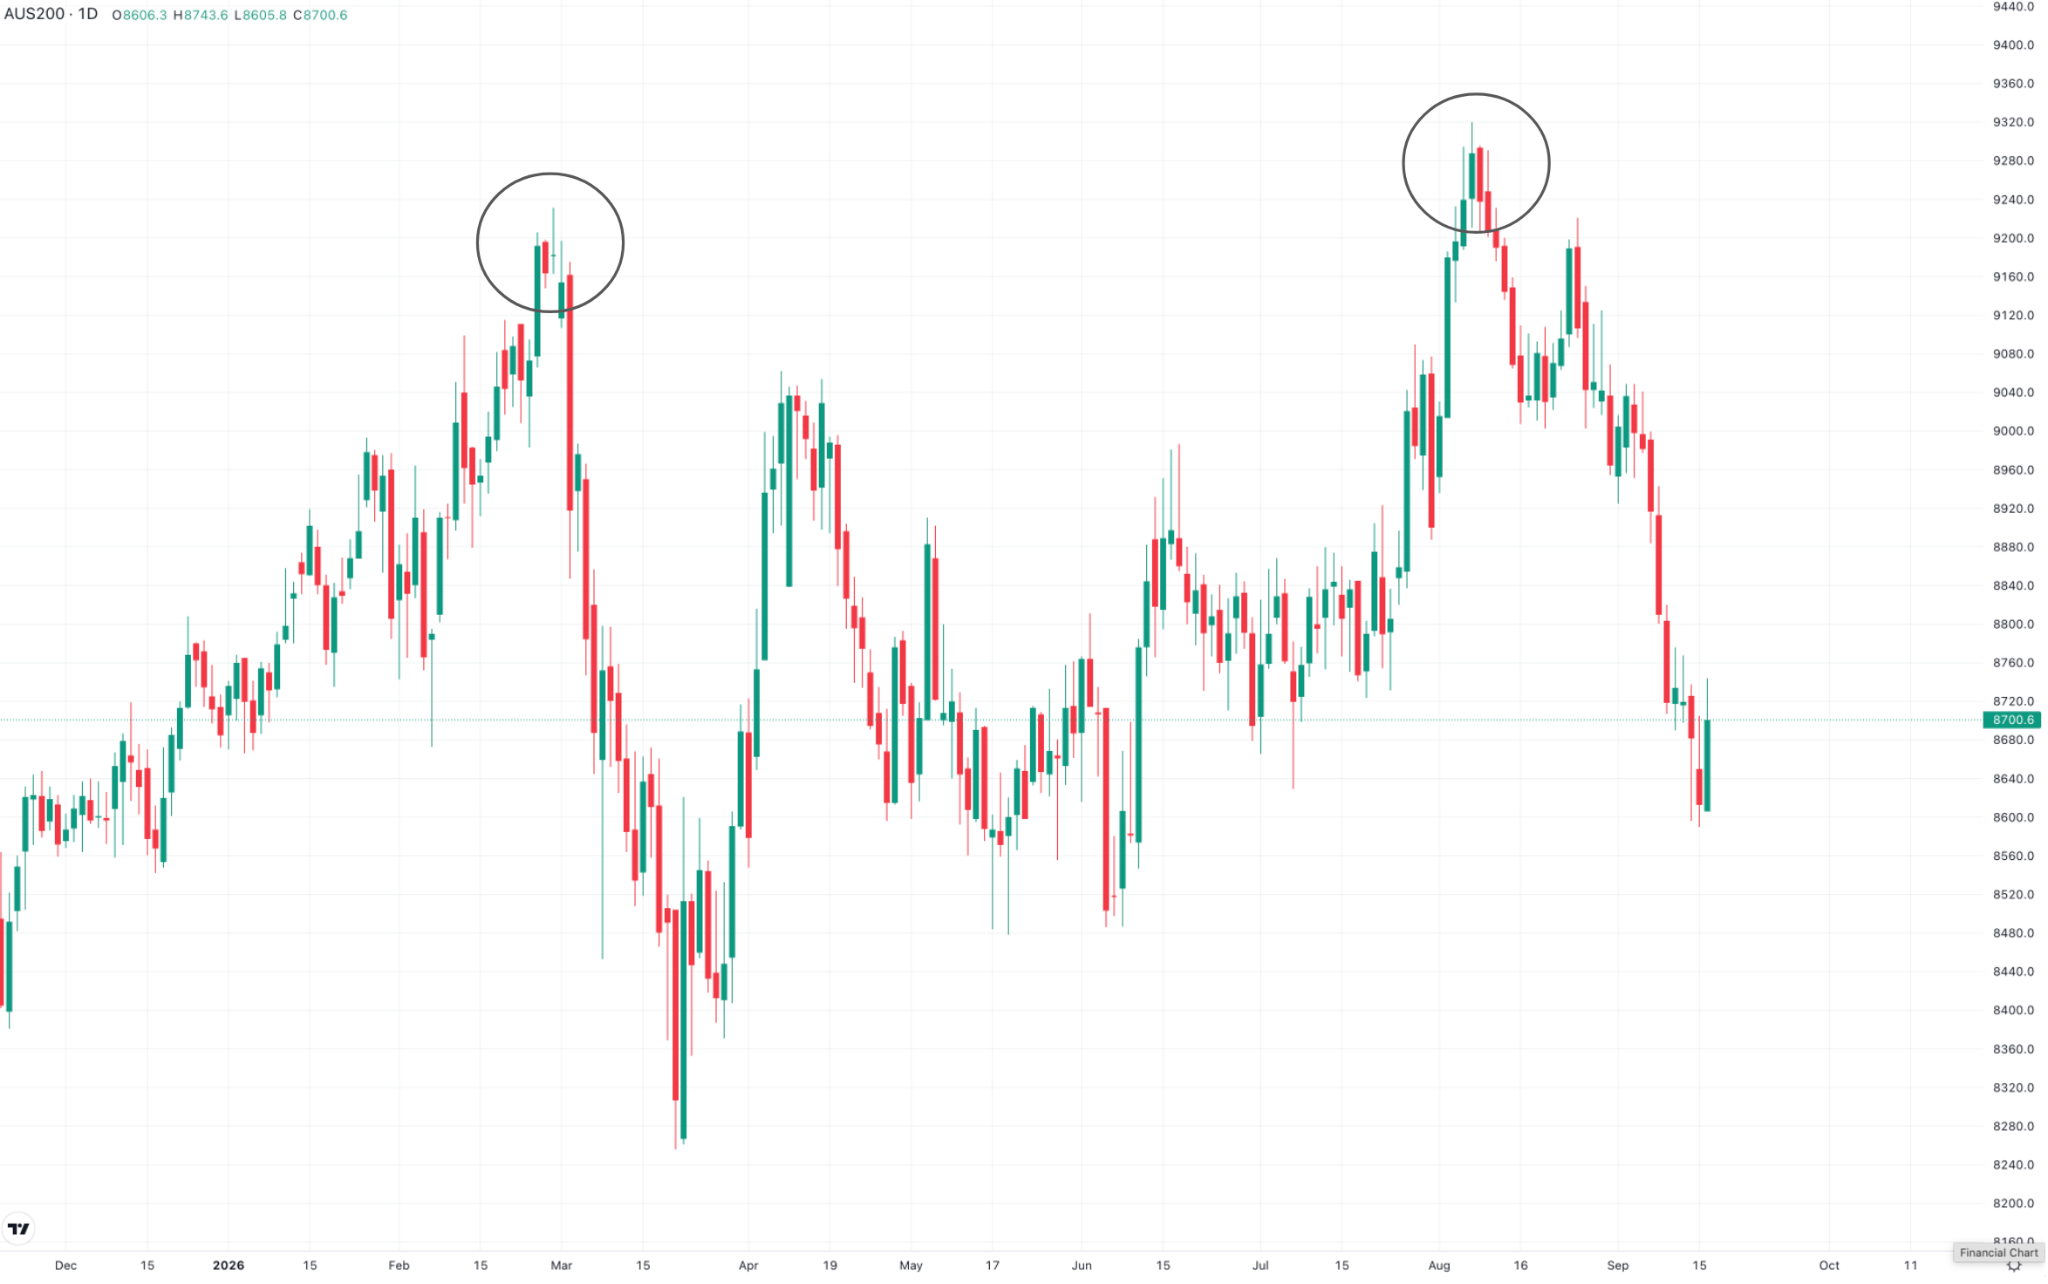
Image - Mitrade (AUS200 Daily Chart, January to September 2026)
Why the August Record Got Rejected
Three forces hit simultaneously after the August record and each contributed to the selloff.
The information technology sector led the decline. Australia's IT stocks followed the Nasdaq sharply lower from mid-August as global concerns about AI infrastructure spending and Federal Reserve rate policy weighed on growth stocks. The broader ASX 200 tracked the weakness within days of its all-time high close. The second factor was earnings season. August reporting brought more earnings disappointments than beats in consumer-facing sectors, where three consecutive RBA rate hikes at 4.35% had squeezed household spending and compressed corporate margins below analyst expectations. The third factor was institutional profit-taking. Australian fund managers who had been long throughout the 1,000-point rally from 8,250 to 9,296.7 used the new high as their exit point. When those sell orders hit the market simultaneously with the IT-led Nasdaq selloff, the index reversed sharply.
The Double Top Pattern and What It Means
The pattern on the 2026 chart tells traders that the 9,250 to 9,300 zone is now a confirmed resistance area, not just a one-time peak.
Price tested this zone in March, got rejected, and fell 1,000 points. Price tested it again in August, got rejected, and fell more than 590 points to current levels. A double top does not guarantee the index falls to new lows. It means the 9,250 to 9,300 zone is a ceiling the index must break through convincingly to resume the uptrend. Convincingly means a daily close above 9,300 on strong volume followed by a second session that holds that level.
A single candle touching 9,296.7 and closing below it is not a confirmed breakout. It is a failed one. The two scenarios from current levels are: the index finds support at 8,600 to 8,700 and rallies back, or it breaks below 8,600 and the double top plays out toward the April low near 8,250.
How to Trade the Bounce Scenario
If the ASX 200 holds above the 8,600 to 8,700 current support zone, the trade setup is a long position targeting a recovery toward the 9,000 to 9,100 area.
The entry sits in the 8,650 to 8,750 range as the index consolidates at current levels. The stop loss goes below 8,550, which is where the bounce trade is invalidated and the breakdown scenario takes over. The first target is 9,000 to 9,050, the zone that acted as resistance for most of 2026 and now serves as the first meaningful hurdle on any recovery.
The second target is 9,150 to 9,200 if the first target breaks with conviction. The risk-reward on this setup from 8,700 with a stop at 8,550 and a target at 9,050 is approximately 2.3 to 1. Risk is 150 points, potential reward is 350 points.
How to Trade the Breakdown Scenario
If the index breaks below 8,600 on sustained selling, a different setup applies entirely.
A daily close below 8,600 signals that the double top pattern is playing out and the index is targeting the April 2026 low at approximately 8,250. The entry is a short position on a confirmed daily close below 8,600, not an intraday wick. The stop loss goes above 8,750 to avoid being stopped out by a brief recovery.
The target is 8,250 to 8,300, the previous major support zone where buyers stepped in aggressively during the April selloff. The risk-reward on this setup from 8,600 short with a stop at 8,750 and a target at 8,300 is 2 to 1. Risk is 150 points, potential reward is 300 points.
“Trade ASX200 with an ASIC-regulated broker. Fast AUD funding via PayID. ”
What a Genuine ASX 200 Breakout Actually Looks Like
The August high was a failed breakout. A genuine breakout to new all-time highs above 9,300 would look very different.
A genuine breakout has three characteristics. First, a daily close above 9,300 with above-average volume, not an intraday spike that reverses before the close. Second, a second daily session that opens above 9,300 and holds that level, confirming buyers are stepping in at the new high. Third, a pullback to 9,250 to 9,300 that holds as support rather than breaking back below.
When all three conditions are met, the long trade from the pullback to 9,250 to 9,300 with a stop below 9,200 is one of the highest probability setups in index trading. When a major index breaks genuinely to new all-time highs after a double top consolidation, short sellers who bet on the rejection are forced to cover and add buying pressure to the rally, accelerating the move higher.
How Australian Traders Access the AUS200 on Mitrade
Mitrade, regulated by ASIC under licence AFSL 398528, offers the AUS200 as an index CFD instrument with a spread of 3.9 points and zero commission on every trade. Australian traders can go long for the bounce scenario or short for the breakdown, from the same account with stop-loss and take-profit controls directly on the order screen before any trade is confirmed.
The practical advantage of trading the AUS200 as a CFD is that both scenarios are equally accessible. A trader who holds ASX shares can only profit if the index rises. A Mitrade CFD trader can profit from the index falling toward 8,250 just as easily as from a recovery toward 9,000.
A free demo account with $50,000 in virtual funds lets Australian traders practise both setups on the live AUS200 price before committing real capital to either direction.
You might be interested in…
1. What is the ASX 200 all-time high and when was it set?
The ASX 200 set an all-time record of 9,296.7 in early August 2026 after breaking out of a 17-week trading range between 8,500 and 9,000. The record followed a strong earnings season for resources and healthcare stocks and the RBA's rate hold at 4.35%. The index has since pulled back to 8,706.6, approximately 590 points below the record, as IT sector weakness, profit-taking, and consumer earnings disappointments drove the selloff.
2. What is a double top pattern and why does it matter for the ASX 200?
A double top pattern forms when an index reaches approximately the same price level twice, gets rejected both times, and falls significantly from each peak. The ASX 200 reached approximately 9,250 in March 2026 before falling to 8,250, then reached 9,296.7 in August 2026 before falling to 8,706.6. Two rejections at the same level confirm the 9,250 to 9,300 zone is strong resistance that the index must break convincingly before resuming an uptrend.
3. What is the key support level to watch on the ASX 200 right now?
The 8,600 to 8,700 zone is the critical near-term support level. A hold above 8,600 opens the path back toward 9,000. A sustained daily close below 8,600 signals the double top pattern is playing out toward the April 2026 low near 8,250, which is the next meaningful support zone below current levels.
4. How is a failed breakout different from a genuine breakout?
A failed breakout occurs when an index briefly moves above a resistance level intraday but closes below it, as happened with the ASX 200 at 9,296.7. A genuine breakout requires a daily close above the resistance level on strong volume, a second session that holds the new level, and a subsequent pullback to that level that holds as support. The August high met none of these conditions fully.
5. What are the price targets for the ASX 200 bounce and breakdown scenarios?
The bounce scenario targets 9,000 to 9,050 initially and 9,150 to 9,200 on a stronger recovery, with an entry in the 8,650 to 8,750 range and a stop loss below 8,550. The breakdown scenario targets 8,250 to 8,300, with an entry on a confirmed daily close below 8,600 and a stop loss above 8,750. Both setups offer risk-reward ratios of approximately 2 to 2.5 to 1.
6. Can Australian traders go short on the ASX 200 on Mitrade?
Yes. Mitrade offers the AUS200 as an index CFD under ASIC regulation with licence AFSL 398528, meaning Australian traders can go short if they believe the double top pattern plays out toward 8,250 or go long if they believe the 8,600 to 8,700 zone holds and a recovery toward 9,000 is the more likely next move. Zero commission applies and a free demo account with $50,000 in virtual funds is available before going live.
Disclaimer: The content presented above, whether from a third party or not, is considered as general advice only. CFD trading involves significant risk of loss. Past performance does not guarantee future results. This article serves informational purposes only and does not constitute financial advice. Consider your risk tolerance before trading.


