




S&P 500 Near Record Highs: Can the Rally Continue? (October 2026 Outlook)

The S&P 500 is trading near record highs after another positive week on Wall Street. On Friday, 9 October 2026, the benchmark index climbed 0.59% to close at 7,811.54, bringing its weekly gain to 1.2% and its year-to-date advance to approximately 14.1%. The rally comes as investors prepare for a busy week of US corporate earnings and inflation data.
For Australian investors and traders, the latest advance raises an important question: can the S&P 500 continue climbing in October, or is the market becoming vulnerable to a pullback?
The outlook depends on several competing forces. Corporate earnings expectations and improving risk sentiment are supporting equities, while elevated US Treasury yields, persistent inflation concerns and uncertainty surrounding energy markets could limit further gains.
This S&P 500 forecast examines the latest rally, the main drivers behind the market, the technical levels traders should monitor and the different ways Australians can gain exposure to US stock market movements.
S&P 500 Market Snapshot: 9 October 2026
Source: Associated Press market data and contemporaneous US market reporting. Figures refer to the 9 October US session; Treasury yields can fluctuate throughout the trading day.
The S&P 500 finished close to its recent record high, reflecting continued demand for US equities. However, the rally has not eliminated the risks facing the market. The 10-year Treasury yield remained elevated, while investors continued to assess inflation expectations and the implications for Federal Reserve policy.
The next phase of the rally may therefore depend less on the headline index level alone and more on whether corporate earnings can justify valuations in an environment of relatively high borrowing costs.
Why Is the S&P 500 Rising?
1. Investors Are Positioning for Third-Quarter Earnings
The start of the US third-quarter earnings season is a major focus for markets in October. Investors will be looking for evidence that companies can sustain profit growth despite higher financing costs, inflation uncertainty and changes in consumer demand.
Major US banks, including JPMorgan Chase, Goldman Sachs, Citigroup and Wells Fargo, are among the companies scheduled to report results during the coming week.
Analysts cited in Reuters reporting expected S&P 500 third-quarter earnings to increase by more than 30% year on year. That figure represents an expectation, not a confirmed result, and actual earnings could differ materially from forecasts.
If companies deliver stronger-than-expected earnings and maintain their outlooks, the results could support equity valuations. Conversely, disappointing results or cautious management guidance could trigger profit-taking, particularly among stocks whose prices already reflect optimistic growth expectations.
For traders, the key question is whether earnings growth can continue to support the index at elevated levels.
2. Technology and AI Expectations Remain Important
Technology companies and businesses linked to artificial intelligence have been important drivers of the broader US equity market in recent years. Expectations surrounding AI investment, semiconductor demand, cloud computing and productivity gains continue to influence investor sentiment.
However, a rising S&P 500 does not necessarily mean every technology stock is advancing. The index is weighted by market capitalisation, so its largest constituents can have a disproportionate influence on its performance.
This creates two important considerations for traders.
First, continued strength in large technology companies could help the index extend its gains. Second, if a small group of heavily weighted stocks weakens, the broader index could come under pressure even when other sectors remain relatively resilient.
Investors should therefore monitor market breadth, sector performance and earnings revisions alongside the headline S&P 500 level.
3. Easing Geopolitical Fears Have Supported Sentiment
News that reduced immediate concerns about a further escalation involving Iran helped support US equities on Friday, 9 October. The S&P 500, Dow Jones and Nasdaq all closed higher.
Nevertheless, geopolitical developments can affect markets through several channels, including oil prices, inflation expectations, business confidence and the outlook for interest rates.
Any sustained reduction in geopolitical risk could improve investor sentiment. Renewed tensions, on the other hand, could push energy prices higher and increase uncertainty around inflation.
For the S&P 500, the direction of oil prices is particularly relevant because a sustained energy-price increase can raise costs for businesses and households while complicating the Federal Reserve's policy decisions.
4. Treasury Yields and Inflation Remain Major Risks
The S&P 500's latest gains have occurred alongside elevated US Treasury yields. On 9 October, the US 10-year Treasury yield reached approximately 5.24%, highlighting the continued pressure from interest rates and inflation concerns.
Higher bond yields can make fixed-income assets more attractive relative to equities. They can also increase borrowing costs for businesses and reduce the present value investors assign to future corporate earnings.
The upcoming US Consumer Price Index (CPI) report will therefore be important. Reuters reported that the inflation release was expected during the following week, ahead of the Federal Reserve's late-October policy meeting.
If inflation proves stickier than expected, markets may reassess the outlook for monetary policy. That could put pressure on equity valuations. A softer-than-expected reading could have the opposite effect, although the market reaction would also depend on employment, growth and other economic indicators.
For traders, the combination of corporate earnings, inflation data and Treasury yields is likely to be more informative than any single headline.
S&P 500 Forecast: Can the Rally Continue in October 2026?
The S&P 500's positive momentum provides a constructive starting point for the October outlook, but a move to new highs is not guaranteed. The next direction will depend on whether earnings, inflation data and investor sentiment support current valuations.
Three scenarios are worth considering.
Bullish Scenario: The S&P 500 Extends Its Advance
The bullish scenario would become more credible if the index holds above its recent breakout area, corporate earnings exceed expectations and Treasury yields stabilise or decline.
Under these conditions, buyers may remain willing to pay higher prices for US equities. Strong earnings guidance from major companies could also broaden participation in the rally beyond a small number of large technology stocks.
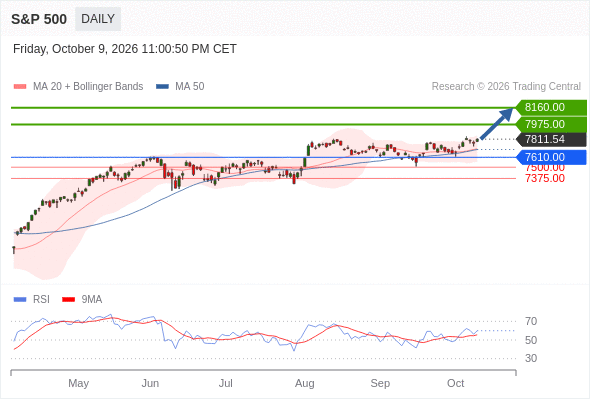
The 7,800 area is an important psychological reference point following the index's latest close above that level. If the S&P 500 holds above it and subsequently establishes higher highs, traders may look towards the 7,900 area and the 8,000 milestone as potential reference points.
These are conditional technical reference levels, not guaranteed price targets. A move towards 8,000 would still require confirmation from price action and market conditions.
Bearish Scenario: Higher Yields Trigger a Pullback
The bearish scenario would become more relevant if inflation surprises to the upside, Treasury yields rise further or corporate earnings disappoint.
Higher yields can pressure equity valuations, particularly for companies whose prices depend heavily on expectations of earnings growth far into the future. Disappointing results from heavily weighted index constituents could also have an outsized effect on the benchmark.
A sustained move back below 7,800 could signal that the recent breakout is losing momentum. Traders would then need to assess the previous swing lows and other support areas on the daily chart to determine whether the move represents a normal correction or a more significant deterioration in trend.
A break below a single round-number level is not enough to confirm a sustained bearish trend. Confirmation would require additional evidence from price structure, market breadth and the broader economic outlook.
Sideways Scenario: The Market Consolidates Near Its Highs
The S&P 500 could also trade sideways while investors wait for greater clarity from earnings and inflation data.
In this scenario, buyers may continue to support the market, but elevated valuations and bond yields could limit the willingness to push prices significantly higher.
Range-bound conditions can be challenging for traders who rely on breakouts. Prices may move above resistance briefly before reversing, creating false signals.
Rather than assuming that every new high will lead to another advance, traders can monitor whether a breakout is sustained and whether price action confirms the move.
S&P 500 Technical Analysis: Key Levels to Watch
Source: Mitrade Trading Analysis
What Would Confirm a Bullish Breakout?
A stronger bullish signal would involve the index holding above the 7,800 area, forming higher highs and attracting broader participation across sectors.
Traders may also look for improving momentum and a favourable response to corporate earnings and inflation releases.
What Would Suggest the Rally Is Losing Strength?
Warning signs could include a failed breakout, a sustained move below 7,800, weakening market breadth or renewed upward pressure on Treasury yields.
If these signals appear together, traders may reassess the probability of a deeper correction. However, technical signals are not predictions with guaranteed outcomes, and market conditions can change rapidly.
* Technical analysis is for educational purposes only. Confirm all price levels against live market data before making trading decisions.
How Can Australians Trade the S&P 500?
Australians can obtain exposure to the S&P 500 through several types of financial products. The most appropriate choice depends on the investor's objectives, time horizon, costs and tolerance for risk.
S&P 500 ETFs vs S&P 500 CFDs
An ETF and a CFD are not interchangeable. ETFs may suit investors seeking longer-term exposure to an index, while CFDs are leveraged derivatives that can be used to speculate on short-term price movements.
CFDs can magnify both gains and losses. Overnight financing charges can also make extended holding periods more expensive, depending on the provider and position.
“Trade S&P 500 CFDs with an ASIC-regulated broker. Fast AUD funding via PayID. ”
How S&P 500 CFD Trading Works
An S&P 500 CFD tracks price movements in the index or a provider's corresponding index instrument, according to the product's terms.
A trader who expects the index to rise may open a buy position. A trader who expects it to fall may open a sell position. If the market moves against the position, losses can accumulate quickly, particularly when leverage is used.
Before opening a trade, Australian traders should understand:
Spread: The difference between the buy and sell prices.
Overnight financing: Charges that may apply when a position is held overnight.
Margin requirements: The funds required to open and maintain a position.
Trading hours: The provider's specific index trading schedule, including any session breaks.
Currency exposure: Whether the product is denominated in US dollars or another currency, and whether currency conversion applies.
Risk controls: Available stop-loss orders, margin close-out arrangements and the product's terms.
A stop-loss order can help manage risk, but it may not execute at the requested price during a market gap or extreme volatility.
Key Risks to Watch Before Trading the S&P 500
Even when the index is close to record highs, several risks could disrupt its upward trend.
Inflation and interest rates: Stronger-than-expected inflation may keep borrowing costs elevated or alter expectations for Federal Reserve policy.
Corporate earnings: Companies may report weaker results or issue cautious guidance, particularly if costs rise or demand slows.
Market concentration: A small number of large companies can have a disproportionate effect on the index. Weakness in these stocks may outweigh gains elsewhere.
Geopolitical and energy risks: Higher oil prices can raise inflationary pressure and operating costs, potentially weighing on corporate profits.
Leverage and volatility: CFD positions can generate substantial losses when the market moves against the trader. Leverage increases exposure relative to the funds committed.
Traders should determine their maximum acceptable loss before entering a position, consider whether the position size is appropriate and avoid risking money they cannot afford to lose.
Trade the S&P 500 CFD with Mitrade
For Australians interested in trading US index movements, Mitrade offers S&P 500 CFD trading.
Index CFDs allow traders to speculate on price movements without owning the underlying index. Depending on their market view, traders may consider buy or sell positions, while recognising that leveraged trading carries substantial risk.
Explore S&P 500 CFD trading with Mitrade and make sure you understand the risks before trading.
*CFDs are complex leveraged products and carry a high risk of losing money. They are not suitable for every investor.


You might be interested in…
1. Why is the S&P 500 rising in October 2026?
The latest advance has been supported by positive investor sentiment, expectations for corporate earnings and reduced immediate concerns about further geopolitical escalation. However, elevated Treasury yields, inflation uncertainty and energy-market risks remain potential headwinds.
2. Can the S&P 500 continue rising in 2026?
Further gains are possible if corporate earnings remain resilient, inflation data support the market and Treasury yields stabilise. However, disappointing earnings or renewed inflation concerns could trigger a pullback. No forecast can guarantee the index's future direction.
3. How can I trade the S&P 500 in Australia?
Australians may obtain exposure through products such as ETFs or index CFDs. ETFs generally provide investment exposure through fund ownership, while CFDs allow traders to speculate on price movements without owning the underlying index. Product costs, risks and regulatory requirements differ.
Disclaimer: The content presented above, whether from a third party or not, is considered as general advice only. CFD trading involves significant risk of loss. Past performance does not guarantee future results. This article serves informational purposes only and does not constitute financial advice. Consider your risk tolerance before trading.


