

Micron Stock Price Forecast: Can Shares Rebound to $1,000 After Four-Week Drop? Watch Key $800 Support

Source Tradingkey

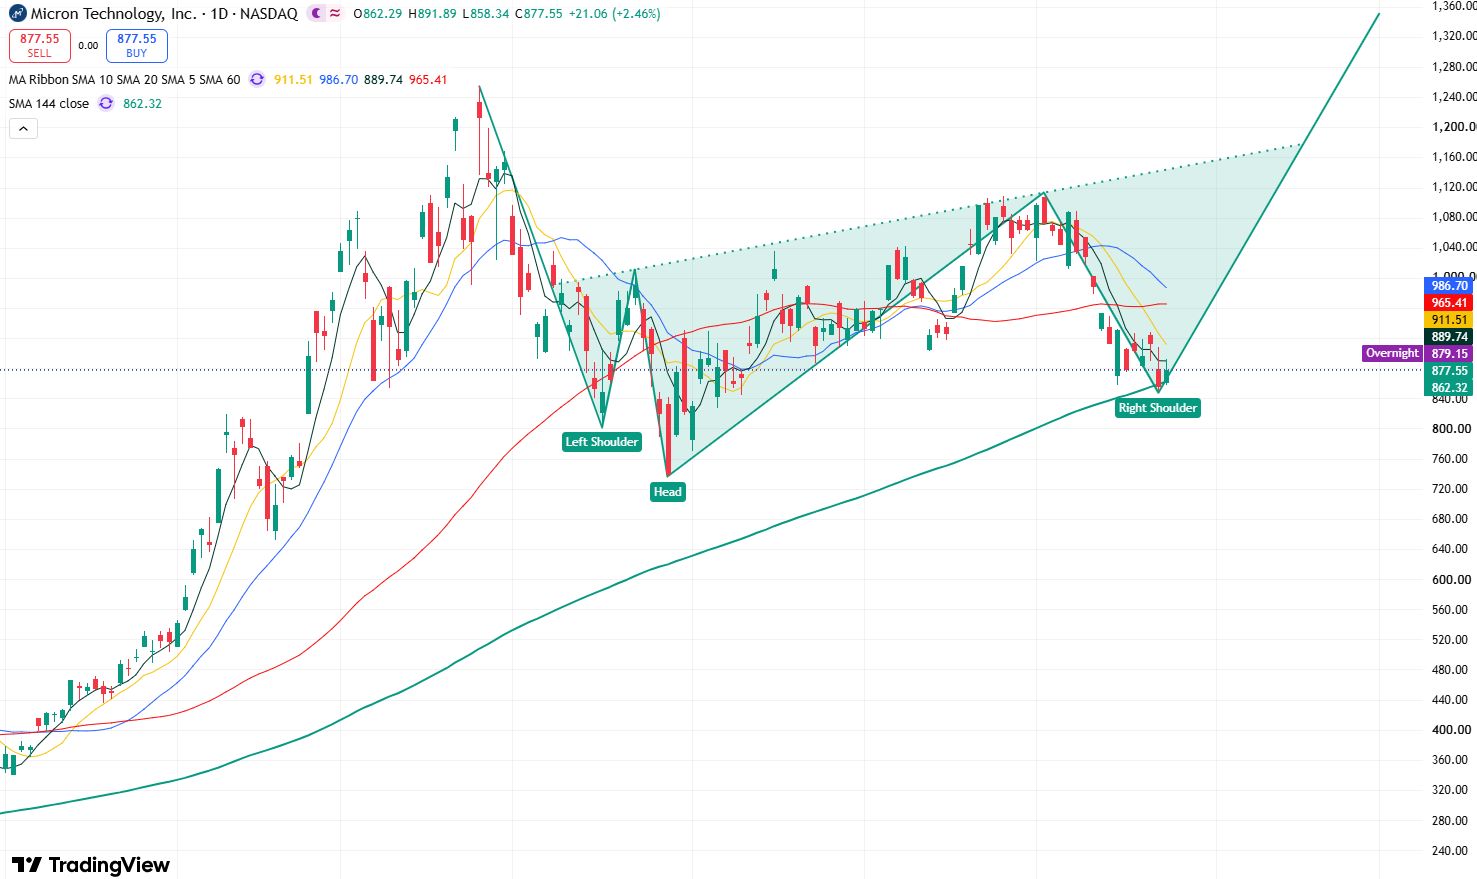
TradingKey - Micron (MU) shares rebounded last Friday (October 23) after recent continuous adjustments. As of the close that day, Micron's stock price closed at $877.55, up 2.46%, reaching an intraday high of $891.89, with trading volume reaching approximately 21.25 million shares, and rising further to around $880 in after-hours trading. Previously on October 22, the stock fell 6.26% in a single day, touching a low of $849.25; thus, the latest rebound has temporarily formed short-term support around $850.
mu-81aacb8f57374dbeb549cc1358e3a90a

Micron stock price daily chart, Source: TradingView

Looking at the daily chart of Micron's stock price, the stock has undergone a continuous pullback recently, at one point retesting above the 144-day moving average and forming a bullish candlestick above it last Friday. This indicates a higher likelihood that the stock has stopped falling, and a rebound trend may emerge in the short term. Notably, the overall stock trend continues to form a head-and-shoulders bottom technical pattern, which means the medium-to-long-term trend remains bullish.

In terms of technical indicators, the Relative Strength Index (RSI) is around 38.2, which is below the 50 midline but has not yet entered the traditional oversold territory below 30. Meanwhile, the MACD is in negative territory, showing that the technical weakness from the previous decline has not been fully repaired. However, the stochastic oscillator and StochRSI have turned up, reflecting an improvement in short-cycle momentum following the rebound near $850.

Currently, the stock has found support near the 144-day moving average ($850). If it confirms a bottom and stabilizes near this moving average in the short term, the stock will see a technical recovery rebound. The primary resistance level above is around $900. If it breaks through this level, the stock will further test resistance at the 60-day moving average ($960). Only when the stock firmly re-establishes itself above the 60-day moving average will upside room toward $1,000 be unlocked.

Conversely, if the stock breaks below the 144-day moving average, it will further probe downward toward $800, the left shoulder of the head-and-shoulders bottom pattern formed by the overall candlestick structure. If this level fails to hold, the stock will further test down to the low of $737.88. If it stays firmly above $800, the head-and-shoulders bottom pattern will remain intact, and the medium-to-long-term trend for the stock will stay bullish.

Disclaimer: For information purposes only. Past performance is not indicative of future results.
placeholder
Markets on a Wire: Imminent US Inflation Data Threatens to Lock In Fed Rate Hikes Imminent CPI and PPI data threaten to lock in a hawkish Federal Reserve rate hike cycle, leaving gold, tech equities, and Bitcoin highly vulnerable to a programmatic sell-off.
Author  Mitrade Team
Jun 09, Tue
Imminent CPI and PPI data threaten to lock in a hawkish Federal Reserve rate hike cycle, leaving gold, tech equities, and Bitcoin highly vulnerable to a programmatic sell-off.
placeholder
XAUUSD Gold Analysis: Gold Holds Above $4,350 Ahead of US Inflation Data Is $4,500 Next? Gold holds above $4,350 following weak US jobs data. As inflation reports approach and UBS eyes $5,000, can XAUUSD break resistance at $4,435 to rally toward $4,500?
Author  Naoufal Seddik
Aug 12, Wed
Gold holds above $4,350 following weak US jobs data. As inflation reports approach and UBS eyes $5,000, can XAUUSD break resistance at $4,435 to rally toward $4,500?
placeholder
Gold Price Analysis Today: Gold Drops 1.32% Despite Lower Fed Rate-Hike Bets, Can $4,313 Support Hold? Gold fell 1.32% on August 13 after rising to $4,449.73, then reversing lower and closing near $4,349.918 below the $4,356.46 support. Softer US inflation data reduced Fed rate hike expectations, but selling pressure still dominated the session. Will $4,313 support hold?
Author  Naoufal Seddik
Aug 14, Fri
Gold fell 1.32% on August 13 after rising to $4,449.73, then reversing lower and closing near $4,349.918 below the $4,356.46 support. Softer US inflation data reduced Fed rate hike expectations, but selling pressure still dominated the session. Will $4,313 support hold?
placeholder
Gold Price Analysis Today: Gold Gains 0.94% as Markets Expect Fed to Hold Rates, Can $4,449 Resistance Break? Gold gained 0.94% on August 17, closing near $4,417.30 as softer US data strengthened expectations for unchanged Fed rates in September. Gold remains bullish, with $4,449.730 resistance and $4,310.650 support in focus.
Author  Naoufal Seddik
Aug 18, Tue
Gold gained 0.94% on August 17, closing near $4,417.30 as softer US data strengthened expectations for unchanged Fed rates in September. Gold remains bullish, with $4,449.730 resistance and $4,310.650 support in focus.
placeholder
3 Stocks That Can Benefit From SpaceX’s Surprise Q3 EarningsSpaceX’s latest earnings have given Wall Street a reason to revisit AI hardware stocks. Elon Musk’s company is preparing to spend billions more on computing infrastructure, and three US-listed stocks
Author  Beincrypto
Oct 21, Wed
SpaceX’s latest earnings have given Wall Street a reason to revisit AI hardware stocks. Elon Musk’s company is preparing to spend billions more on computing infrastructure, and three US-listed stocks
goTop
quote