


Nvidia Stock Forecast: Huang's Neocloud Funding Remarks Push NVDA Into the $206.89 Demand Zone
TradingKey - Nvidia Corporation (NVDA) fell 4.40% to $212.21 on Thursday, October 22, from its previous close of $221.97. This extended its pullback from its October high of $243.47. Overnight quotes showed it trading at $214.33. On Thursday, its decline cut approximately $235 billion from its market value, which currently stands at about $5.11 trillion.
Its stock declined alongside the rest of the chip sector on Thursday following Lam Research's (LRCX) supply warning and Meta's (META) spending. It also declined due to comments made by CEO Jensen Huang during an interview with CNBC at the GTC event in Berlin, where he discussed funding for neoclouds, cloud providers such as CoreWeave and Nebius that provide AI computing power under heavy pressure from Lam Research's supply warning and Meta's spending.
What Huang Said About Neoclouds
Huang said, "The demand for neoclouds is off the charts." The constraint, according to Huang, is funding: "What is missing in the middle is the working capital to fuel that growth." He added, "The demand for capital is much greater than the supply of the capital."
Huang implied that this is a constraint that will be resolved. However, the market interpreted this as a possible sign that some of Nvidia's fastest-growing customers may face funding constraints and, by extension, may be unable to purchase Nvidia's chips. CoreWeave, a neocloud provider, declined 10.06% on Thursday to a 17-month low.
Chip Stocks Fell Across the Board
The Philadelphia Semiconductor Index fell 6.72% to close at 10,731.98, its lowest close since July 29. All 30 of the Index's stocks ended lower. Lam Research fell 11.76% after warning of supply constraints that will persist through 2027. Advanced Micro Devices and Marvell also declined by 8.10% and 8.70% respectively. Dell Technologies and Meta fell by 6.78% and 6.98% respectively. The former reported its worst month since February 2021, and the latter fell the day after reporting capex above its operating cash flow.
Stock Titan estimates that chip and data storage companies led the $1.32 trillion Nasdaq-100 losses, shedding 55% of the overall decline, or about $700 billion, in just a few days.
Yields Fell, but Chips Still Dropped
Treasury yields fell sharply on Thursday, with the 10-year falling by 17 basis points to close at 4.96%. Lower yields usually boost growth stocks, but the Nasdaq Composite fell by 2.60% and the Dow ended flat. That points to selling aimed at AI spending.
Why Neocloud Funding Matters for Nvidia
Nvidia's supply and capacity commitments increased to $279 billion as of July 26, from $119 billion a quarter earlier. The increases were largely for memory. Nvidia is on the hook for these costs, regardless, if customers are unable to fund their purchases.
Nvidia's maximum exposure for guarantees was $108.5 billion, but the majority of that, $105 billion, is related to the SB Energy Ohio campus leases for OpenAI. Only $3.5 billion is exposure for AI leases. In August, Nvidia announced partnerships with capital providers to facilitate $500 billion of financing for AI infrastructure.
Fundamentals Remain Strong
In the second quarter, Nvidia reported revenue of $96.2 billion, an increase of 106% over last year, and data center revenue of $89.0 billion. Adjusted EPS was $2.22, beating the consensus estimate of $2.10. The company also reported a gross margin of 75.0%. Management projected revenue of $108 billion for fiscal Q3, with data center compute revenue from China excluded from this number. CFO Colette Kress also commented on the company’s plans for fiscal 2028 and said to expect revenue growth of 70%. Kress noted that the company is still supply constrained.
Nvidia’s fiscal Q3 report is expected to be released on November 18, but the company has not confirmed this. Prior to this report, comments made by CFO Kress will likely have a greater impact on NVDA than any comments made by CEO Jensen Huang.
Nvidia Technical Analysis: Daily Close Below $206.89 Could Open $197.75
Looking at the daily chart, NVDA’s latest bounce hit horizontal resistance at $222.23, where it meets the moving average at $221.23. Selling pressure knocked NVDA down below the second moving average at $215.68, and into the top of the $206.89 to $212 demand zone. Demand zones are areas of price support that are defended by buyers. The demand zone here is also defended by a rising trend line from the March lows. This means the $207 area has been a floor for NVDA since August.
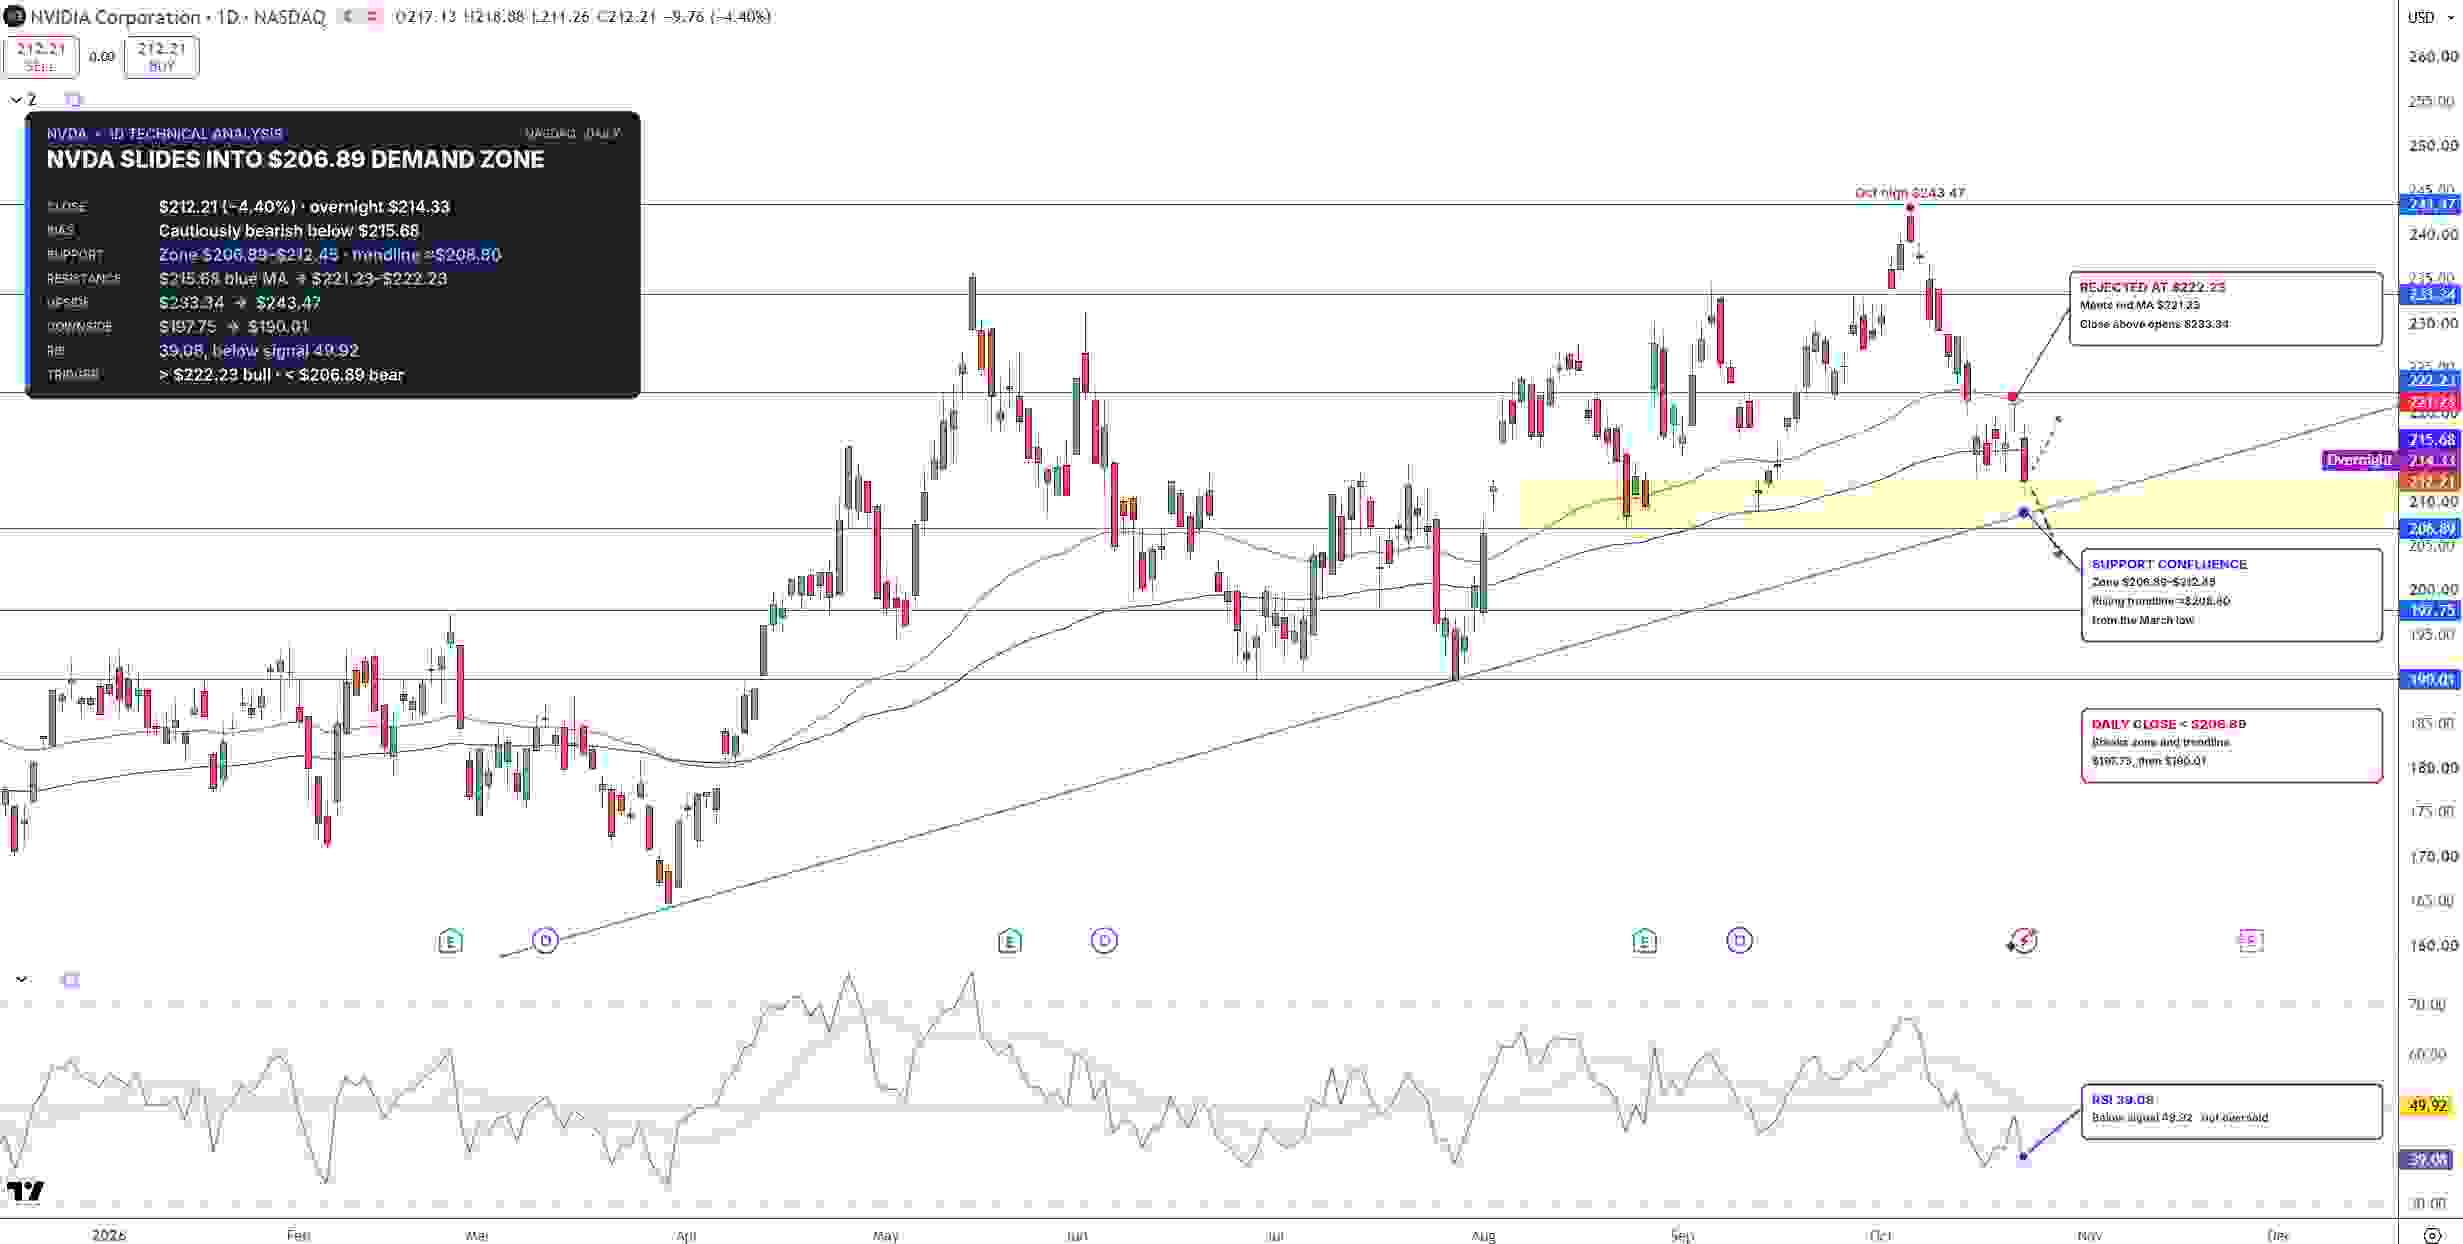
Nvidia Stock Price Chart - Source: Tradingview
RSI is currently at 39 and is below both the 50 midline, and its signal line. Momentum is turning bearish and is still above the oversold level, which indicates that sellers are not yet tired.
The first area of resistance is at $215.68, with the next wall of resistance sitting at $221.23 to $222.23. If NVDA breaks above the $222.23 resistance, it would neutralize the bearish rejection, and could open to as high as $233.34. If the opposite occurs and NVDA breaks support at $206.89, it would also break the rising trendline from March and resume the decline to $197.75, and then to $190.01.
For now, with NVDA trading below $215.68, I’d agree with the bearish bias, but the trendline around $207 is still likely to produce a bounce.
Key Levels
Last close: $212.21, down 4.40% on October 22
Support: $206.89 to $212, $197.75, $190.01
Resistance: $215.68, $221.23 to $222.23, $233.34, $243.47
RSI: 39.08, below its 49.92 signal line
Bullish trigger: Daily close above $222.23
Bearish trigger: Daily close below $206.89
FAQs
Why did Nvidia stock fall on October 22?
Nvidia dropped 4.40% after Jensen Huang said neoclouds lack the working capital to fund their growth, even though demand is “off the charts.” This comment was made during a broad-based selloff in the chip sector that sent the Philadelphia Semiconductor Index down 6.72%.
What is the Nvidia stock forecast now?
The bias is cautiously bearish below $215.68. If the stock trades below $206.89, look for downside potential to $197.75 and $190.01. On the upside, a breakout above $222.23 will bring $233.34 into focus.
Bottom Line
In this case, Nvidia’s own numbers suggest that demand is not the issue, but rather that supply is the constraint. Regardless, the selloff on Thursday was a clear reminder of how sensitive Nvidia’s stock is to any uncertainty in the market related to who is going to pay for the build out of AI. The level that matters is $206.89, which is where the rising trendline from March meets the demand zone. A daily close below it would put $197.75 in focus. Only a close above $222.23 would turn the picture around.
Recommended Articles


