

Eli Lilly Stock Nears $1,292 All-Time High as Technicals Point to Potential New Record

Source Tradingkey

TradingKey - Eli Lilly (LLY) shares held near $1,260 on Thursday, just about 2% away from its all-time high of $1,292. From a technical perspective, Eli Lilly's stock price has cleared a key resistance level and is poised to break out to a new record high.

As for stock catalysts, a week-long sell-off in AI hardware stocks prompted capital to rotate into defensive sectors dominated by pharmaceutical stocks, driving its share price higher.

On the other hand, Prelude Therapeutics reached a clinical trial collaboration with Eli Lilly. The two parties will combine Prelude's oral KAT6A degrader PRT13722 with Eli Lilly's breast cancer drugs Verzenio and Inluriyo in a Phase 1 study targeting patients with HR+/HER2- breast cancer.

The main highlight of this collaboration lies in the joint development path combining the novel candidate drug with Eli Lilly's existing breast cancer therapies. Wall Street analysts responded very positively to this partnership.

Earnings expectations are another backdrop factor driving capital into Eli Lilly stock. The company has confirmed that it will report its third-quarter 2026 financial results and host a conference call on October 29.

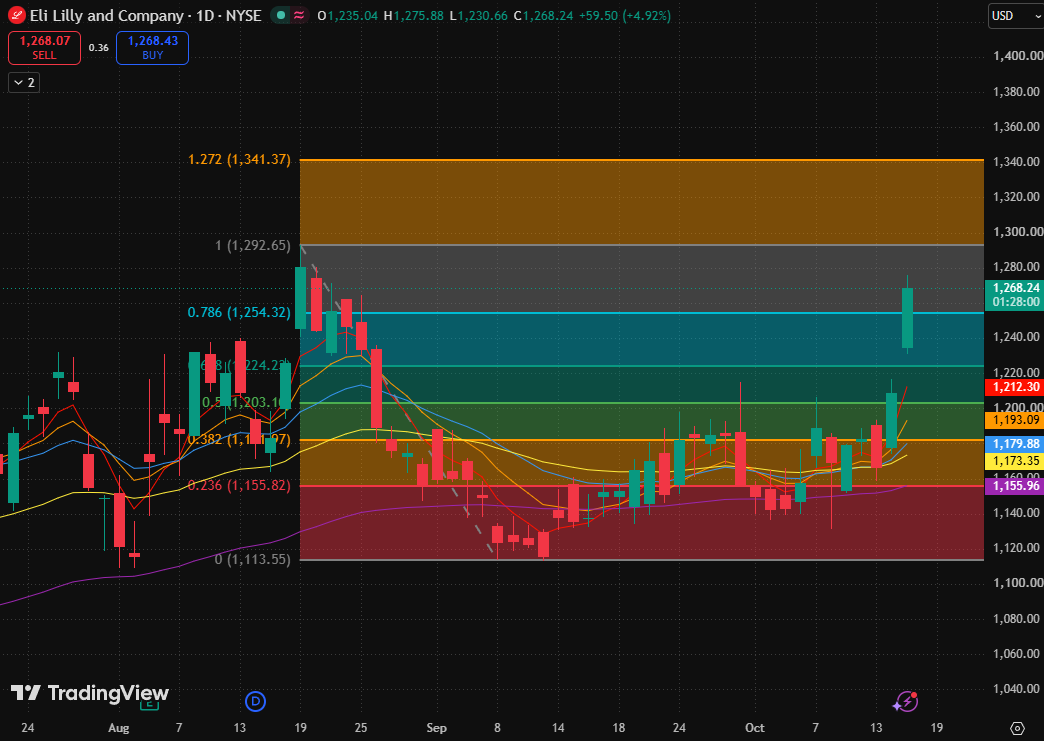
From a technical perspective, Eli Lilly pulled back from its August high, stopped falling at lower levels in September, and then consolidated sideways. This recent series of gains broke the previous consolidation pattern that repeatedly met resistance. The latest candlestick gapped up and continued higher, indicating that the trend has shifted from range-bound fluctuation to an active bullish assault, though supply pressure from previous highs remains overhead.
3-b7bfb96987af4ae2bc7602d4ec6e4edf

Source: TradingView

Regarding moving averages, the 5-day, 10-day, 20-day, 80-day, and 160-day exponential moving averages are at $1,212.30, $1,193.09, $1,179.88, $1,173.35, and $1,155.96, respectively, forming a bullish alignment from short to long term, with short-term moving averages fanning upward.

If the stock price holds firm above the 0.786 Fibonacci retracement level ($1,254), it is expected to break through to a new all-time high. It should be noted that the primary risk is failing to hold after crossing key resistance, resulting in a false breakout. If the price falls back below the breakout line and further loses the second support level, the current assessment of 'gapping up and strengthening' will be significantly weakened, and the pullback may extend toward the third support level.

Disclaimer: For information purposes only. Past performance is not indicative of future results.
placeholder
XRP Price Prediction for July 2026: Can Buyers Finally Break the Downtrend?XRP (XRP) price trades near $1.05, caught between a year-long downtrend and a sudden burst of buying.July has historically rewarded XRP holders. This year the month arrives with on-chain accumulation
Author  Beincrypto
Jun 30, Tue
XRP (XRP) price trades near $1.05, caught between a year-long downtrend and a sudden burst of buying.July has historically rewarded XRP holders. This year the month arrives with on-chain accumulation
placeholder
What to Expect From Ethereum (ETH) in July 2026Ethereum (ETH) enters July 2026 trading near $1,570, close to multi-month lows, after recording its first run of three consecutive red quarterly candles in its history.On-chain data and price charts n
Author  Beincrypto
Jul 01, Wed
Ethereum (ETH) enters July 2026 trading near $1,570, close to multi-month lows, after recording its first run of three consecutive red quarterly candles in its history.On-chain data and price charts n
placeholder
XAUUSD Gold Analysis: Gold Holds Above $4,350 Ahead of US Inflation Data Is $4,500 Next? Gold holds above $4,350 following weak US jobs data. As inflation reports approach and UBS eyes $5,000, can XAUUSD break resistance at $4,435 to rally toward $4,500?
Author  Naoufal Seddik
Aug 12, Wed
Gold holds above $4,350 following weak US jobs data. As inflation reports approach and UBS eyes $5,000, can XAUUSD break resistance at $4,435 to rally toward $4,500?
placeholder
Gold Price Analysis Today: Gold Drops 1.32% Despite Lower Fed Rate-Hike Bets, Can $4,313 Support Hold? Gold fell 1.32% on August 13 after rising to $4,449.73, then reversing lower and closing near $4,349.918 below the $4,356.46 support. Softer US inflation data reduced Fed rate hike expectations, but selling pressure still dominated the session. Will $4,313 support hold?
Author  Naoufal Seddik
Aug 14, Fri
Gold fell 1.32% on August 13 after rising to $4,449.73, then reversing lower and closing near $4,349.918 below the $4,356.46 support. Softer US inflation data reduced Fed rate hike expectations, but selling pressure still dominated the session. Will $4,313 support hold?
placeholder
Gold Price Analysis Today: Gold Gains 0.94% as Markets Expect Fed to Hold Rates, Can $4,449 Resistance Break? Gold gained 0.94% on August 17, closing near $4,417.30 as softer US data strengthened expectations for unchanged Fed rates in September. Gold remains bullish, with $4,449.730 resistance and $4,310.650 support in focus.
Author  Naoufal Seddik
Aug 18, Tue
Gold gained 0.94% on August 17, closing near $4,417.30 as softer US data strengthened expectations for unchanged Fed rates in September. Gold remains bullish, with $4,449.730 resistance and $4,310.650 support in focus.
goTop
quote