

Google Stock Price Forecast: Bucks Trend With Three-Day Rally, Shares Poised to Challenge $380 Again

Source Tradingkey

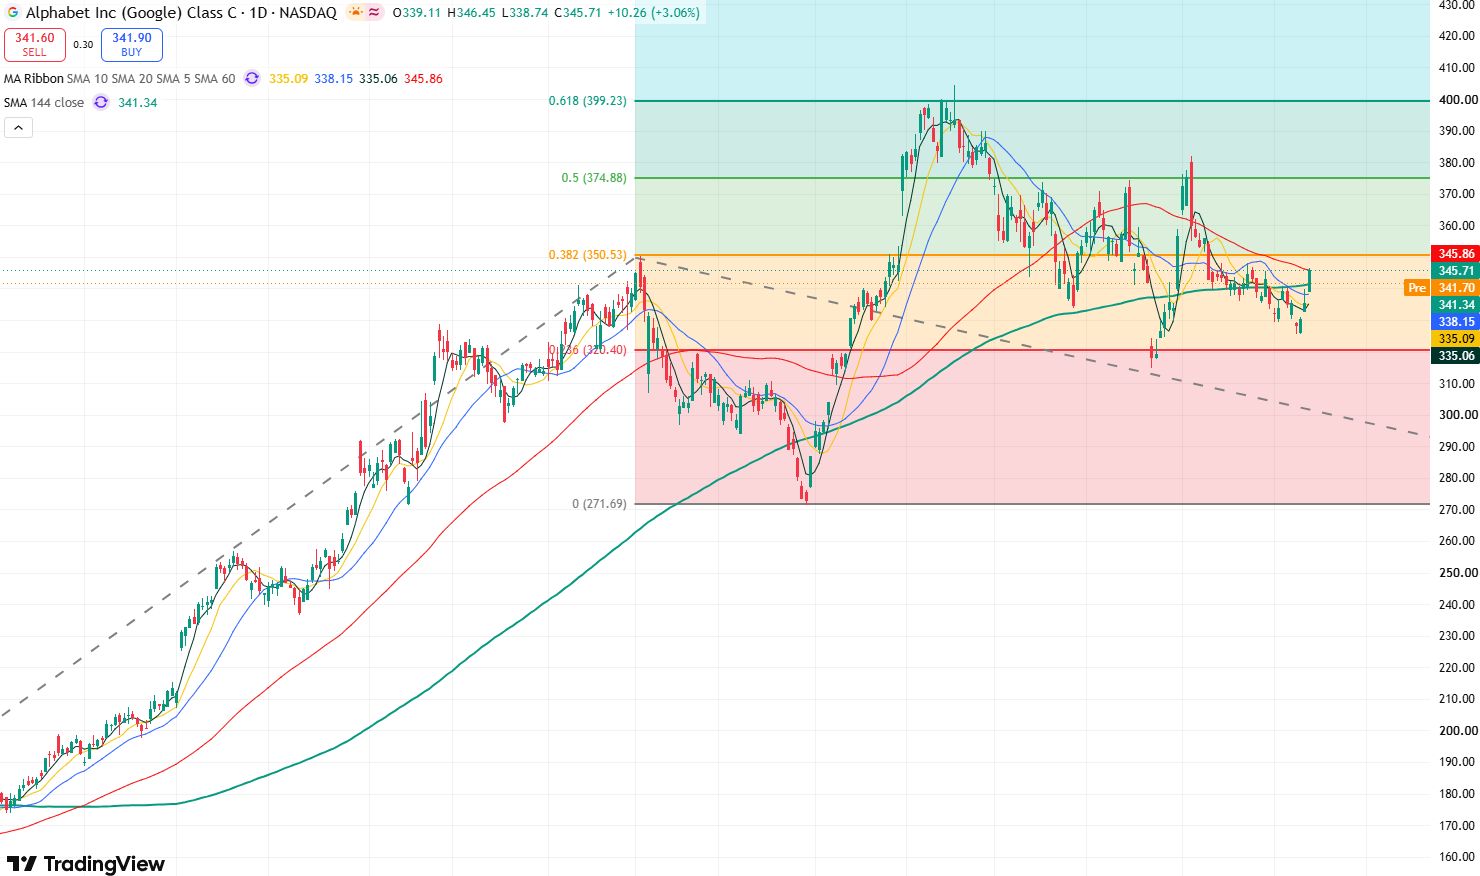
TradingKey - As of the close on September 14 Eastern Time, against the backdrop of a 0.48% drop in the S&P 500 Index and a 0.56% decline in the Nasdaq, Google's parent company Alphabet (GOOGL) bucked the trend to gain 3.06%, closing at $345.71 after touching an intraday high of $349.89, marking its third consecutive trading day of gains and showing a clear strengthening in its recent trend; trading volume rose to approximately 35.9 million shares, noticeably higher than recent levels.

Analysts believe that calls from executives at OpenAI, Anthropic, and xAI to slow down frontier AI development may ease Google's massive AI capital expenditure and competitive pressures in the short term, serving as a key catalyst for the stock's strength that day.
goog-cafeccce74584248b24a59f352be1d4d

GOOGL daily price chart, Source: TradingView

Looking at the daily price chart of GOOGL, the stock has rebounded continuously after falling to $325.63 on September 9, and has now reclaimed its major short-term moving averages. The latest 5-day, 10-day, and 20-day moving averages stand at approximately $335.06, $335.09, and $338.15, respectively, while the 144-day moving average is at $341.24. The current stock price is above these moving averages, showing a clear improvement in the short-term trend.

Regarding technical indicators, the 14-day RSI has risen to 73.6, entering overbought territory, which suggests the risk of a short-term pullback may be gradually increasing; the MACD remains positive and maintains a buy signal. Although the risk of a near-term pullback might be growing, market momentum clearly favors the bulls, leaving room for further gains in the short term.

Currently, the stock price has risen to just below the 60-day moving average and remains under the short-term resistance level of $350. If the stock can effectively break out and hold above $350 in the short term, it is expected to challenge its recent rebound high of $381.81 again.

On the downside, the primary support level to watch below is near $325; if this level fails to hold, the stock may suffer a deeper pullback toward the July low near $314.89.

Disclaimer: For information purposes only. Past performance is not indicative of future results.
placeholder
XRP Price Prediction for July 2026: Can Buyers Finally Break the Downtrend?XRP (XRP) price trades near $1.05, caught between a year-long downtrend and a sudden burst of buying.July has historically rewarded XRP holders. This year the month arrives with on-chain accumulation
Author  Beincrypto
Jun 30, Tue
XRP (XRP) price trades near $1.05, caught between a year-long downtrend and a sudden burst of buying.July has historically rewarded XRP holders. This year the month arrives with on-chain accumulation
placeholder
What to Expect From Ethereum (ETH) in July 2026Ethereum (ETH) enters July 2026 trading near $1,570, close to multi-month lows, after recording its first run of three consecutive red quarterly candles in its history.On-chain data and price charts n
Author  Beincrypto
Jul 01, Wed
Ethereum (ETH) enters July 2026 trading near $1,570, close to multi-month lows, after recording its first run of three consecutive red quarterly candles in its history.On-chain data and price charts n
placeholder
Intel Price Forecast: Nvidia Picked Xeon 6, Invested $5B, Yet Analysts Still Trail INTCIntel Corporation (NASDAQ: INTC) sits at $140.05, holding firm on the ascending trendline within the 2H timeframe. The RSI indicator is currently reading 55.21, positioning it as neutral-
Author  TradingKey
Jul 02, Thu
Intel Corporation (NASDAQ: INTC) sits at $140.05, holding firm on the ascending trendline within the 2H timeframe. The RSI indicator is currently reading 55.21, positioning it as neutral-
placeholder
Gold Price Analysis Today: Gold Drops 1.32% Despite Lower Fed Rate-Hike Bets, Can $4,313 Support Hold? Gold fell 1.32% on August 13 after rising to $4,449.73, then reversing lower and closing near $4,349.918 below the $4,356.46 support. Softer US inflation data reduced Fed rate hike expectations, but selling pressure still dominated the session. Will $4,313 support hold?
Author  Naoufal Seddik
Aug 14, Fri
Gold fell 1.32% on August 13 after rising to $4,449.73, then reversing lower and closing near $4,349.918 below the $4,356.46 support. Softer US inflation data reduced Fed rate hike expectations, but selling pressure still dominated the session. Will $4,313 support hold?
placeholder
Gold Price Analysis Today: Gold Gains 0.94% as Markets Expect Fed to Hold Rates, Can $4,449 Resistance Break? Gold gained 0.94% on August 17, closing near $4,417.30 as softer US data strengthened expectations for unchanged Fed rates in September. Gold remains bullish, with $4,449.730 resistance and $4,310.650 support in focus.
Author  Naoufal Seddik
Aug 18, Tue
Gold gained 0.94% on August 17, closing near $4,417.30 as softer US data strengthened expectations for unchanged Fed rates in September. Gold remains bullish, with $4,449.730 resistance and $4,310.650 support in focus.
goTop
quote