


Top Altcoins Price Forecast: Ripple, Cardano, Hyperliquid – Easing bullish momentum sparks downside risks
- Ripple edges lower by 2% on Tuesday, easing after a 6% jump the previous day.
- Cardano is down 2% on Tuesday, extending its consolidation above the $0.20 round figure.
- Hyperliquid trades below $80, facing near-term downside pressure as momentum eases to neutral levels.
Top altcoins, including Ripple (XRP), Cardano (ADA), and Hyperliquid (HYPE), are trading in the red on Tuesday, with roughly 2% losses so far. The altcoins are facing downside pressure ahead of the CLARITY Act cloture vote scheduled for Tuesday, which will establish clarity for the crypto market structure. The technical outlook for XRP, ADA, and HYPE indicates a mixed bias as momentum eases to neutral levels.
Ripple remains capped below key resistance
Ripple trades around $1.40 at press time on Tuesday, extending its consolidation range. The cross-border remittance token consolidates between the 50% and 78.6% Fibonacci retracement levels, at $1.2964 and $1.5137, respectively, measured over the upswing from $0.9888 to $1.6999.
XRP maintains a constructive bullish bias as price holds above the 50-period and 100-period Exponential Moving Averages (EMAs) on the four-hour chart at $1.3854 and $1.3754, with the 200-period EMA much lower at $1.3246, suggesting a supportive medium-term structure.
The Relative Strength Index (RSI) on the four-hour chart near 54 suggests moderate upside momentum, while the Moving Average Convergence Divergence (MACD) line remains slightly above the signal line, reflecting the mild bullish tone.
On the downside, immediate support is seen at the 50-period EMA at $1.3854, followed by the 100-period EMA at $ 1.3754. A deeper pullback could revisit the 50% Fibonacci level at $1.2964 and the 200-period EMA at $1.3246, where broader trend buyers may look to defend the uptrend.
On the topside, initial resistance emerges at the 78.6% Fibonacci retracement near $1.5137, with a subsequent hurdle at the $1.6999 swing high if buyers extend the advance.
Cardano risks falling below a crucial support zone
Cardano trades around $0.20 on Tuesday, holding a neutral to slightly constructive tone. ADA consolidates above the 50-day and 100-day EMAs near $0.20 and $0.19 but remains capped well below the 200-day EMA at roughly $0.24.
The RSI around 50 underscores range-bound momentum, while the MACD remains below the signal line, suggesting that downside pressure is gradually strengthening.
The 50% retracement level at $0.1999, measured over the downswing from $0.287 to $0.1385, serves as the immediate support, reinforced by the 50- and 100-day EMAs. A decisive close below this support could extend the decline toward the 23.6% Fibonacci retracement level at $0.1647.
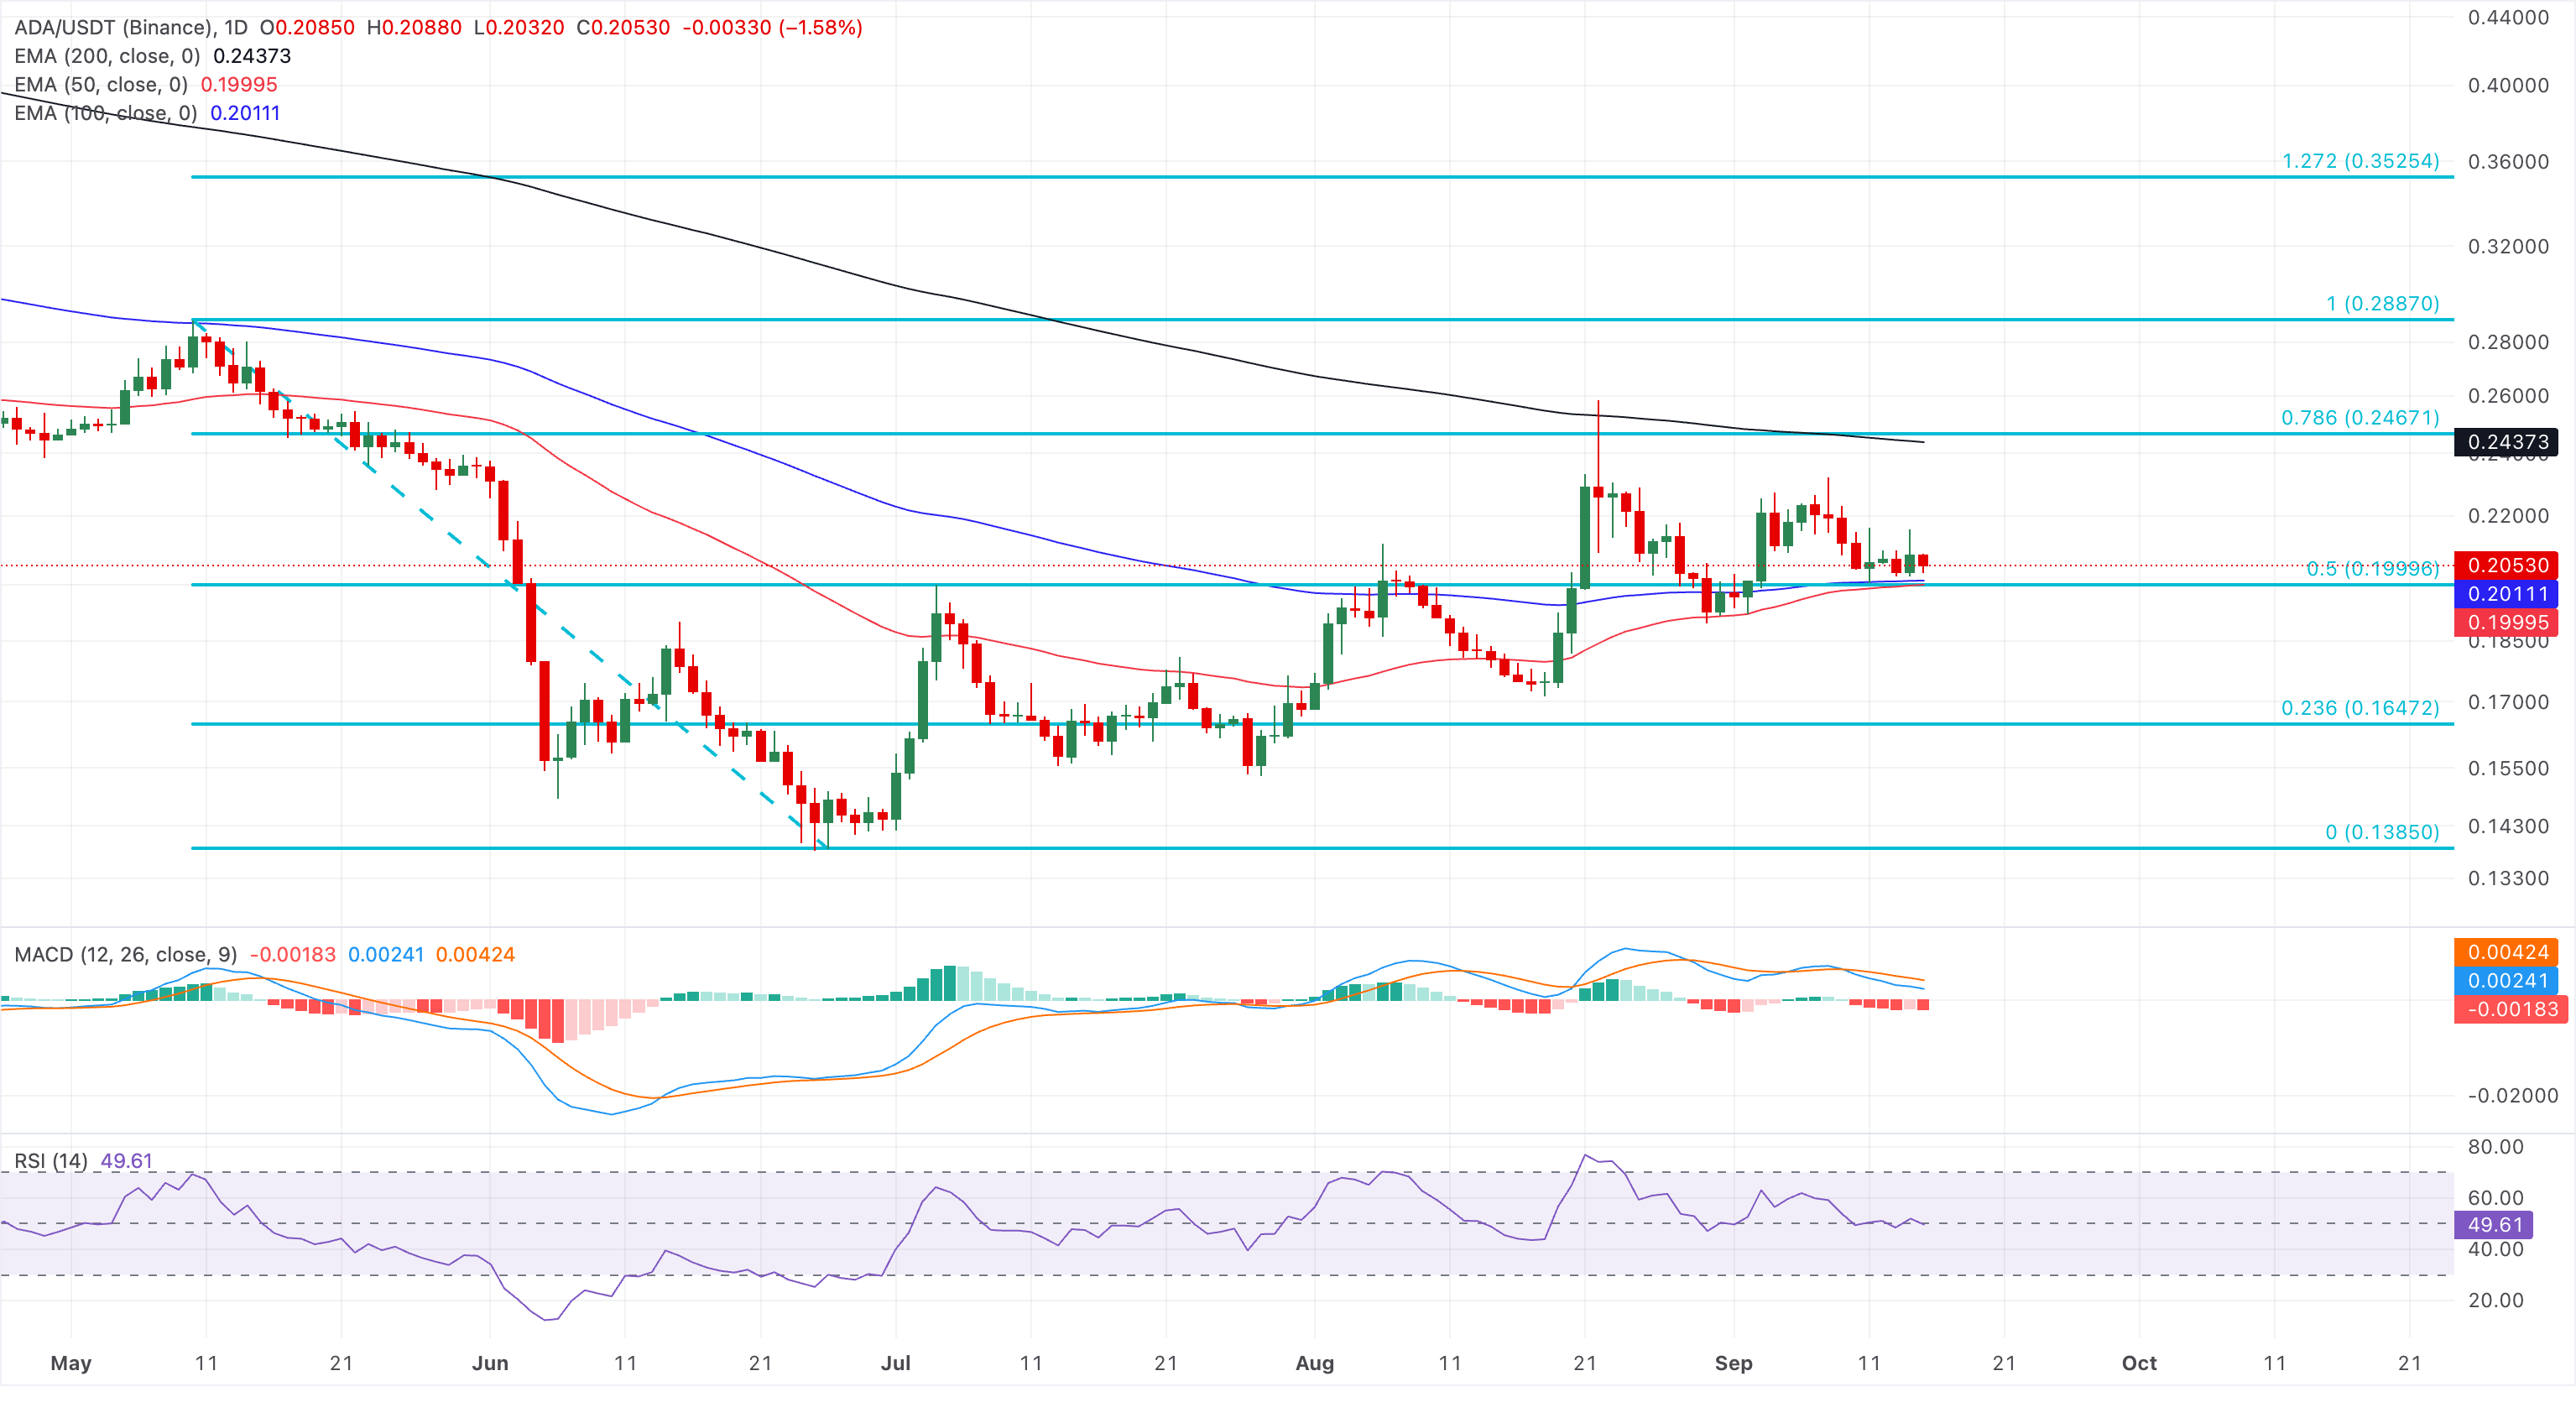
Looking up, the 200-day EMA at $0.2437 and the 78.6% Fibonacci retracement at $0.2467 serve as immediate resistance levels. A decisive breakout above this zone could target the $0.2887 swing high.
Hyperliquid risks a deeper pullback as upside momentum wanes
Hyperliquid edges below $80 on Tuesday but maintains a constructive bullish bias following its rally to a record high of $89.61 on September 6. HYPE sustains above the key 50-, 100-, and 200-day EMAs around $73.91, $67.25, and $59.11, underpinning the broader structure.
Momentum is mixed, with the RSI hovering near a neutral 51 and the MACD extending a downtrend below its signal line, suggesting that upside follow-through could be slower.
A potential rebound could face the 127.2% Fibonacci extension level, measured from $51.20 to $76.93, at $85.94, as the next barrier, followed by the 161.8% Fibonacci extension level at $98.95.
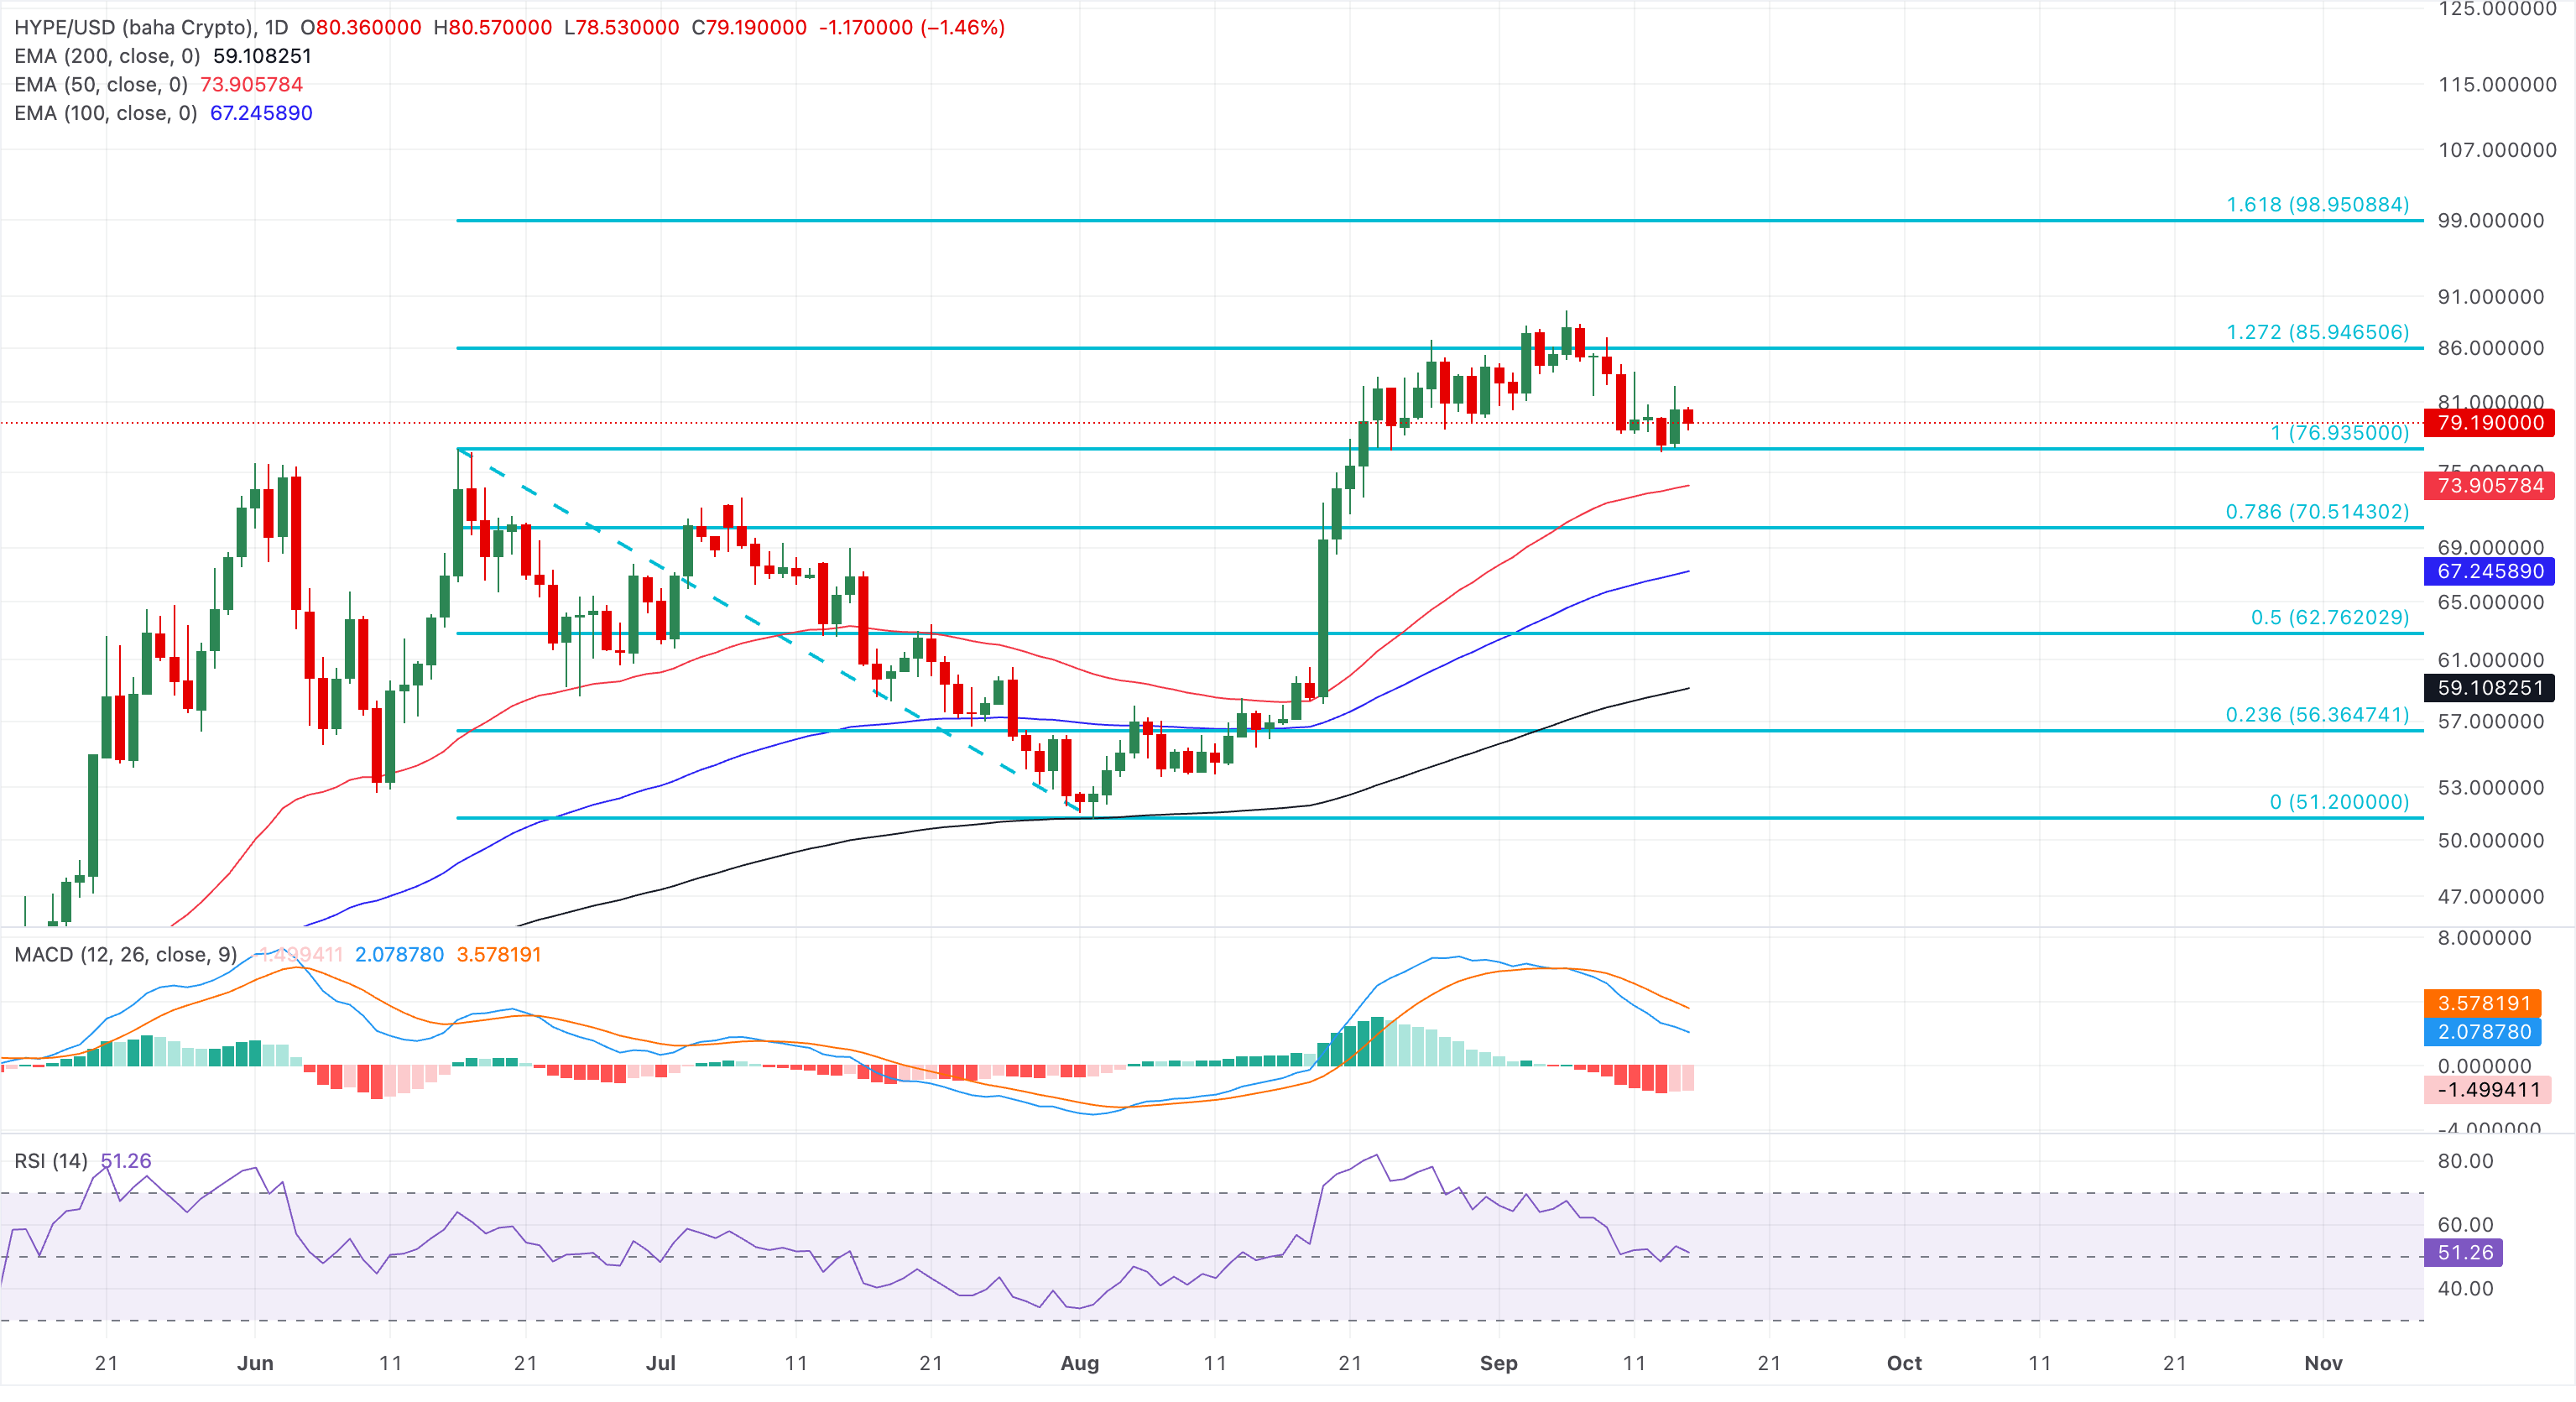
On the flip side, immediate support emerges at the recent swing region near the 100% Fibonacci retracement at $76.94, ahead of the clustered 50-day EMA at $73.91 and the 78.6% retracement at $70.51, which together form a first significant demand band if prices pull back.
(The technical analysis of this story was written with the help of an AI tool. Know more.)
Recommended Articles


